Market Update — May 2026

We firmly believe timely and relevant data is key to making good decisions. To this end, we are committed to providing our community and clients with actionable data and insights about the local real estate market.
Local real estate market
With the data from April 2026 in, here’s an overview of the key aspects of the local real estate market. The real estate data below is collected from Northwest Multiple Listing Service (NWMLS).
Median price: The chart below shows the latest median sales prices of homes over the past 5 years in the Greater Seattle area over the past five years:
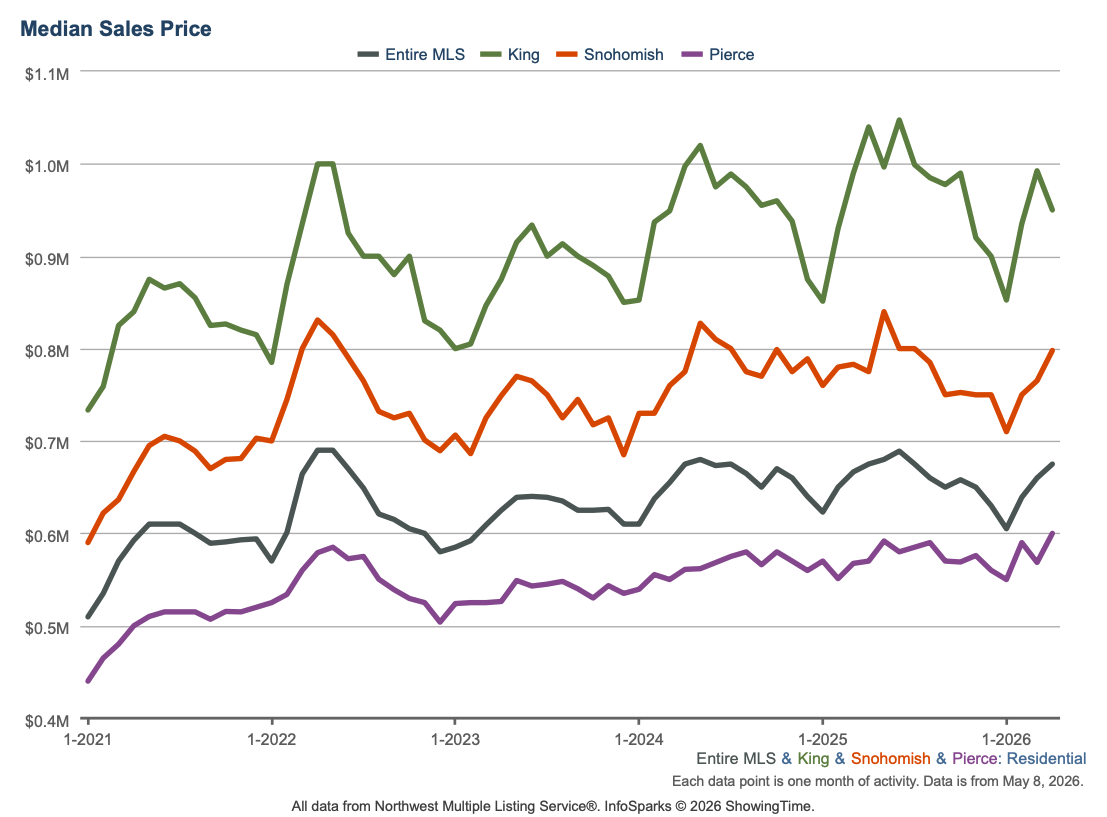
Homes sold: 5,674 homes were sold in April 2026, which is about the same YOY (5,887 in 2025). The median price of $650,000 showing no change YOY. This total sale volume translates to a dollar value of about $4.6B.
New construction: 658 new construction homes were sold in April 2026. The median sale price of new construction homes was $725,000.
Months of inventory: Given the current quantity of supply, it’ll take 3.27 months for every listed home to sell. To put this number in perspective, note that the months of inventory for a balanced market is considered to be 4 to 6 months. The counties with the lowest months of inventory in April 2026 were Kitsap (1.94), Pierce (2.52), Thurston (2.54), Douglas (2.72). This data point indicates the persistent shortage of supply relative to demand in the area.
New listings: 12,155 new listings were added to the NWMLS database in April 2026 representing a YOY increase of 12%.
Mortgage rates: The Freddie Mac rate has shown no significant monthly change.
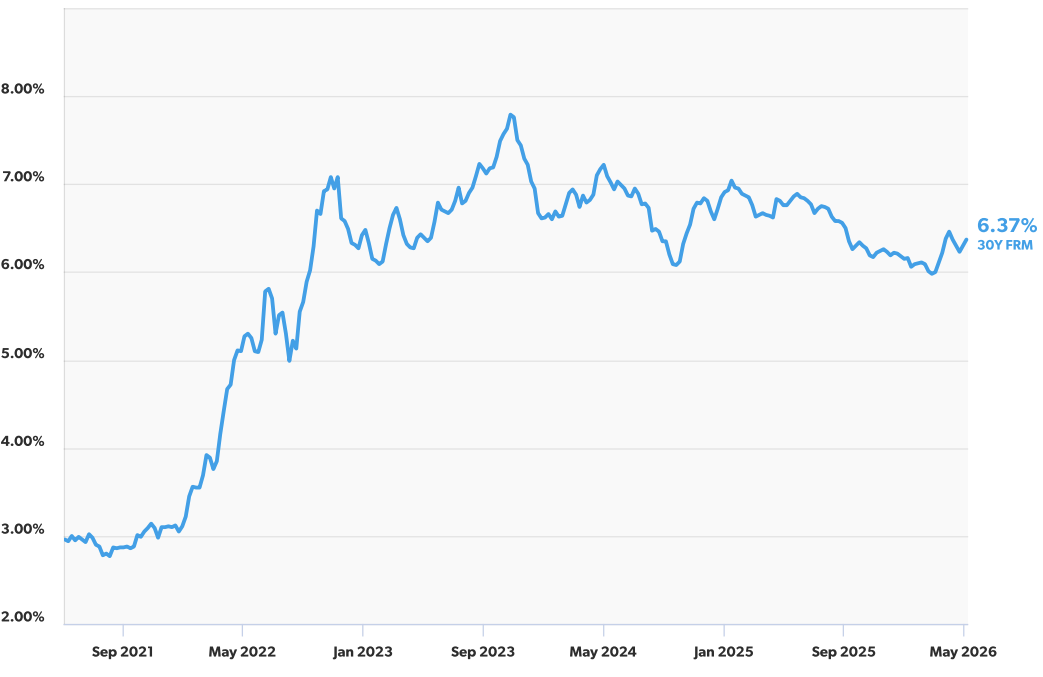
Primary Mortgage Market Survey — Average 30-Year Fixed Mortgage Rates over the past 5 years (Source: Freddie Mac)
Broader U.S. economy
Fed Holds Rates Steady Amid Growing Policy Debate: As expected, the Federal Reserve left its benchmark Federal Funds Rate unchanged at 3.50% to 3.75%, marking its third straight meeting without a change after cuts late last year. While this rate doesn’t directly determine mortgage rates, it plays a major role in shaping borrowing costs across the economy. What’s the bottom line? Although the pause was widely anticipated, the decision revealed growing division within the central bank, with four officials dissenting – the highest number in decades. One favored an immediate rate cut, while others pushed back on signaling that cuts are likely ahead, even as they agreed to hold rates steady for now.
Rising Oil Prices Push Inflation Higher: Headline Personal Consumption Expenditures (PCE) rose 0.7% in March, driven largely by a surge in gas prices tied to Middle East tensions, lifting the annual rate to 3.5%. The Fed’s preferred inflation measure, core PCE (which excludes food and energy), increased a more moderate 0.3%, with the annual rate at 3.2%. What’s the bottom line? Inflation is still running above target, reinforcing the Fed’s cautious approach. It also helps explain why some policymakers are in no rush to cut rates as they weigh mixed signals across the economy.
Appreciation Highlights Homeownership Benefits: U.S. home values edged up from January to February, rising 0.3% before seasonal adjustments and 0.1% after, according to the Case-Shiller Home Price Index. Year over year, prices are up 0.7%. Data from the Federal Housing Finance Agency (FHFA) shows prices were mostly flat month over month (seasonally adjusted), with a stronger 1.7% annual gain for homes backed by conventional loans. What’s the bottom line? Home prices have now increased for seven consecutive months, per Case-Shiller, at roughly a 3% annual pace. Even modest gains can make a difference over time. For instance, a $500,000 home appreciating at 3% would add about $15,000 in value in a year, underscoring the long-term wealth potential of homeownership.