Market Update — April 2026

We firmly believe timely and relevant data is key to making good decisions. To this end, we are committed to providing our community and clients with actionable data and insights about the local real estate market.
Local real estate market
With the data from March 2026 in, here’s an overview of the key aspects of the local real estate market. The real estate data below is collected from Northwest Multiple Listing Service (NWMLS).
Median price: The chart below shows the latest median sales prices of homes over the past 5 years in the Greater Seattle area over the past five years:
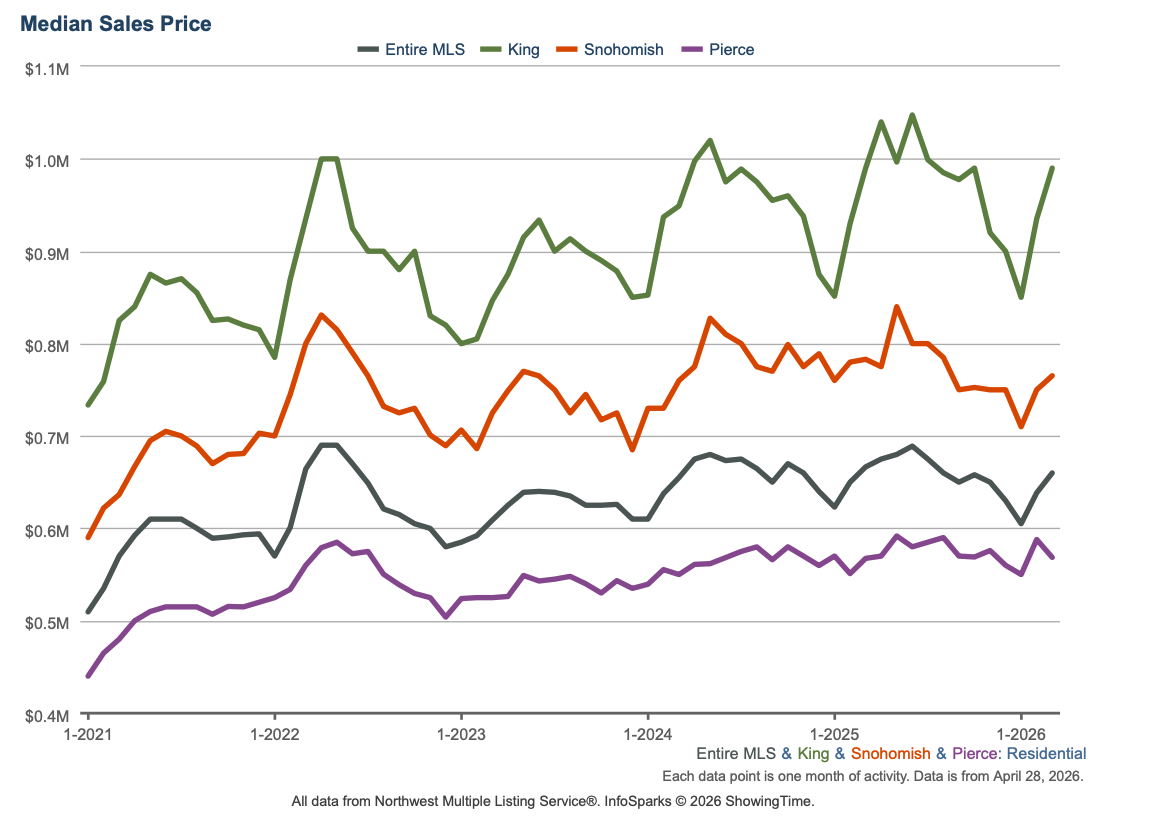
Homes sold: 5,417 homes were sold in March 2026, which is about the same YOY (5,406 in 2025). The median price of $640,000 which represents a decrease of 1.5% YOY. This total sale volume translates to a dollar value of about $4.3B.
New construction: 749 new construction homes were sold in March 2026. The median sale price of new construction homes was $750,000.
Months of inventory: Given the current quantity of supply, it’ll take 2.78 months for every listed home to sell. To put this number in perspective, note that the months of inventory for a balanced market is considered to be 4 to 6 months. The counties with the lowest months of inventory in March 2026 were Kitsap (1.57), Snohomish (2.04), Pierce (2.07), and Thurston (2.09). This data point indicates the persistent shortage of supply relative to demand in the area.
New listings: 10,035 new listings were added to the NWMLS database in March 2026 representing a YOY increase of 9.5%.
Mortgage rates: The Freddie Mac rate has shown no significant monthly change.
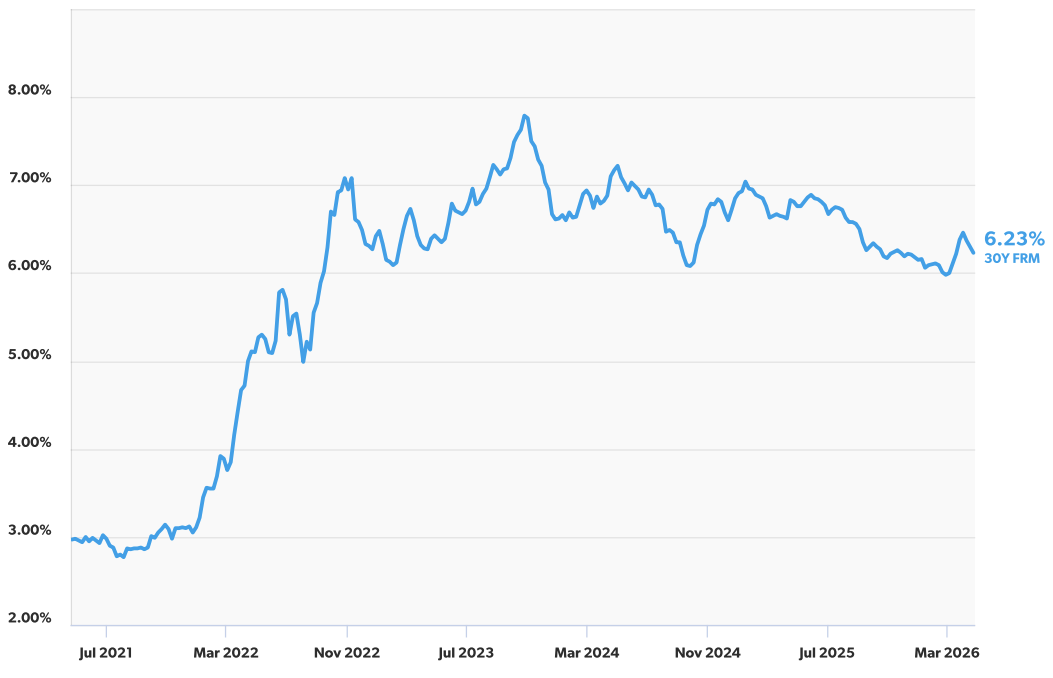
Primary Mortgage Market Survey — Average 30-Year Fixed Mortgage Rates over the past 5 years (Source: Freddie Mac)
Broader U.S. economy
Pending Home Sales See Modest March Uptick: Pending home sales, which reflect signed contracts on existing homes, rose 1.5% from February to March, exceeding expectations. While activity remains somewhat below this time last year, the monthly increase is a positive sign. The Northeast and South led the gains, while the Midwest and West experienced some slowdown. What’s the bottom line? Buyers remain active despite higher mortgage rates, pointing to ongoing pent-up demand
Retail Sales Rise, Driven by Higher Gas Prices: Retail sales increased 1.7% in March, topping economists’ forecasts. Core retail sales, which exclude autos, gas, building materials, and food services, also came in stronger than expected, rising 0.7%. This core measure is important because it feeds directly into GDP. However, even though gas is excluded, higher fuel costs can still push up prices across other categories, which may be boosting the overall numbers. Much of the increase was driven by a sharp jump in gasoline spending, as higher oil prices led consumers to pay more at the pump – not necessarily because overall spending has increased. That means the headline strength may not reflect a surge in broader economic activity. If elevated energy prices continue, it will be important to watch whether spending on discretionary items starts to slow.