Market Update — March 2026

We firmly believe timely and relevant data is key to making good decisions. To this end, we are committed to providing our community and clients with actionable data and insights about the local real estate market.
Local real estate market
With the data from February 2026 in, here’s an overview of the key aspects of the local real estate market. The real estate data below is collected from Northwest Multiple Listing Service (NWMLS).
Median price: The chart below shows the latest median sales prices of homes over the past 5 years in the Greater Seattle area over the past five years:
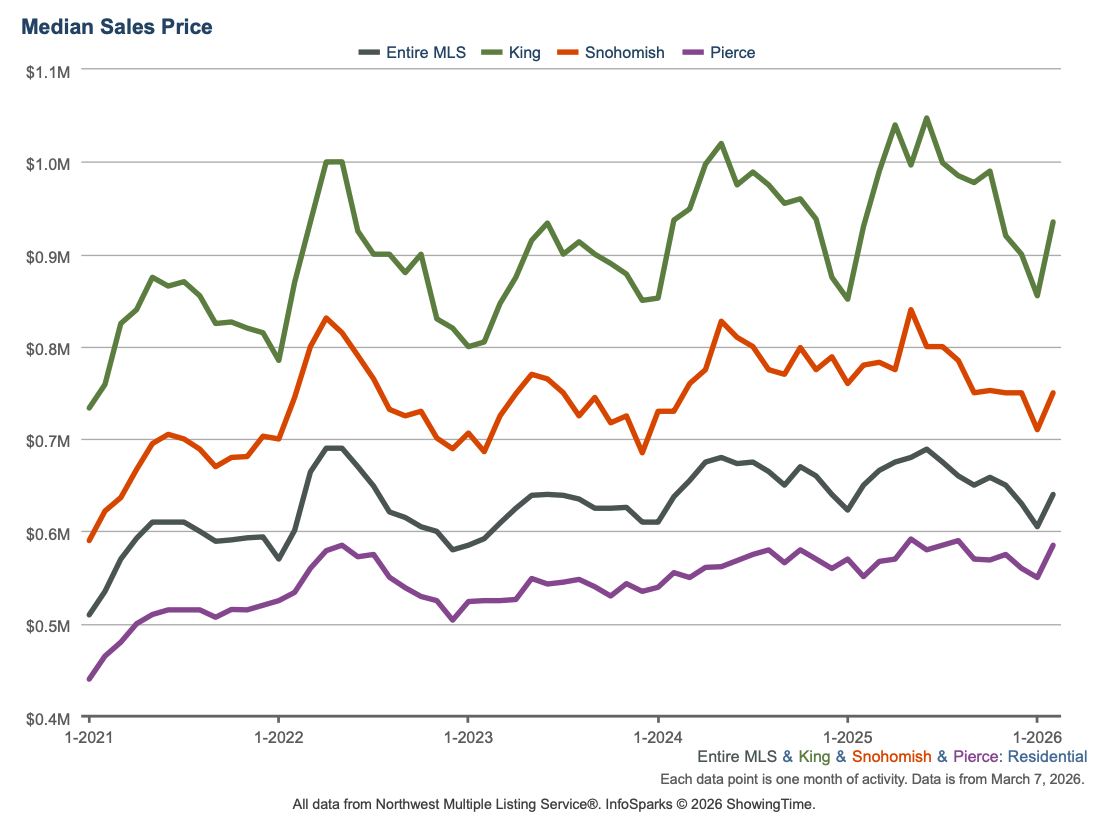
Homes sold: 4,139 homes were sold in February 2026 decreasing 3% YOY. The median price of $620,000 which represents a decrease of 1.6% YOY. This total sale volume translates to a dollar value of about $3.2B.
New construction: 645 new construction homes were sold in February 2026. The median sale price of new construction homes was $750,000.
Months of inventory: Given the current quantity of supply, it’ll take 3.22 months for every listed home to sell. To put this number in perspective, note that the months of inventory for a balanced market is considered to be 4 to 6 months. The counties with the lowest months of inventory in February 2026 were Kitsap (2.14), Snohomish (2.36), Island (2.43), Thurston (2.59), and Pierce (2.6). This data point indicates the persistent shortage of supply relative to demand in the area.
New listings: 7,424 new listings were added to the NWMLS database in February 2026 representing a YOY increase of 17%.
Mortgage rates: The Freddie Mac rate has shown no significant monthly change.
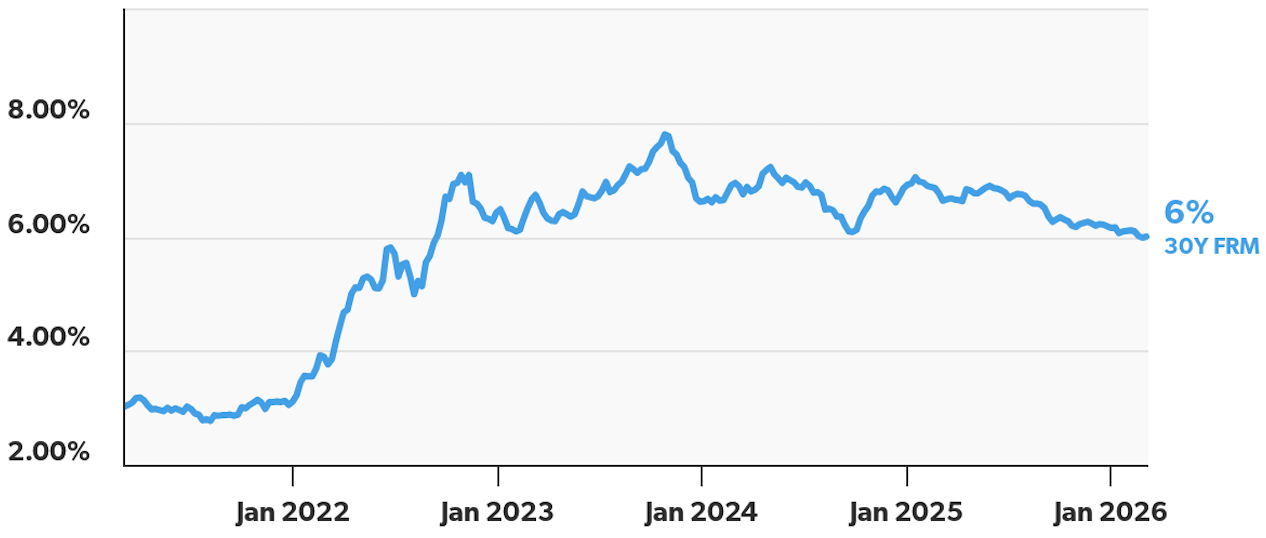
Primary Mortgage Market Survey — Average 30-Year Fixed Mortgage Rates over the past 5 years (Source: Freddie Mac)
Broader U.S. economy
Buyer Activity Supports Home Values: The closely watched Case-Shiller Home Price Index showed prices dipped 0.3% from November to December before seasonal adjustments. After accounting for typical seasonal trends, prices actually rose 0.4%, marking another month of solid gains. On an annual basis, national home prices are up 1.3%.
Gig Work May Be Masking Labor Market Strain: Initial jobless claims rose by 4,000 to 212,000 in the latest week, still low by historical standards. Meanwhile, continuing claims (the number of people receiving benefits beyond their first week) fell by 31,000 to 1.833 million.