Market Update — March 2025

We firmly believe timely and relevant data is key to making good decisions. To this end, we are committed to providing our community and clients with actionable data and insights about the local real estate market.
Local real estate market
With the data from February 2025 in, here’s an overview of the key aspects of the local real estate market. The real estate data below is collected from Northwest Multiple Listing Service (NWMLS).
Median price: The chart below shows the latest median sales prices of homes over the past three years in the Greater Seattle area over the past three years:

Homes sold: 4,268 homes were sold in February 2025 (up 1.9% compared to 4,189 in February 2024). The median price of $630,000 which represents a 3.6% increase YOY. This total sale volume translates to a dollar value of about $3.3B.
New construction: 745 new construction homes were sold in February 2025. The median sale price of new construction homes was $773,420.
Months of inventory: Given the current quantity of supply, it’ll take 2.45 months for every listed home to sell. To put this number in context, note that the months of inventory for a balanced market is considered to be 4 to 6 months. The counties with the lowest months of inventory in February 2025 were Snohomish (1.44), Thurston (2.04), Pierce (2.07), King (2.14), and Kitsap (2.15). The data indicates the persistent shortage of supply relative to demand.
New listings: 6,346 new listings were added to the NWMLS database in February 2025 representing a decrease of 2.6% compared to February 2024.
Mortgage rates: This month the Freddie Mac rate shows no major month-over-month change.
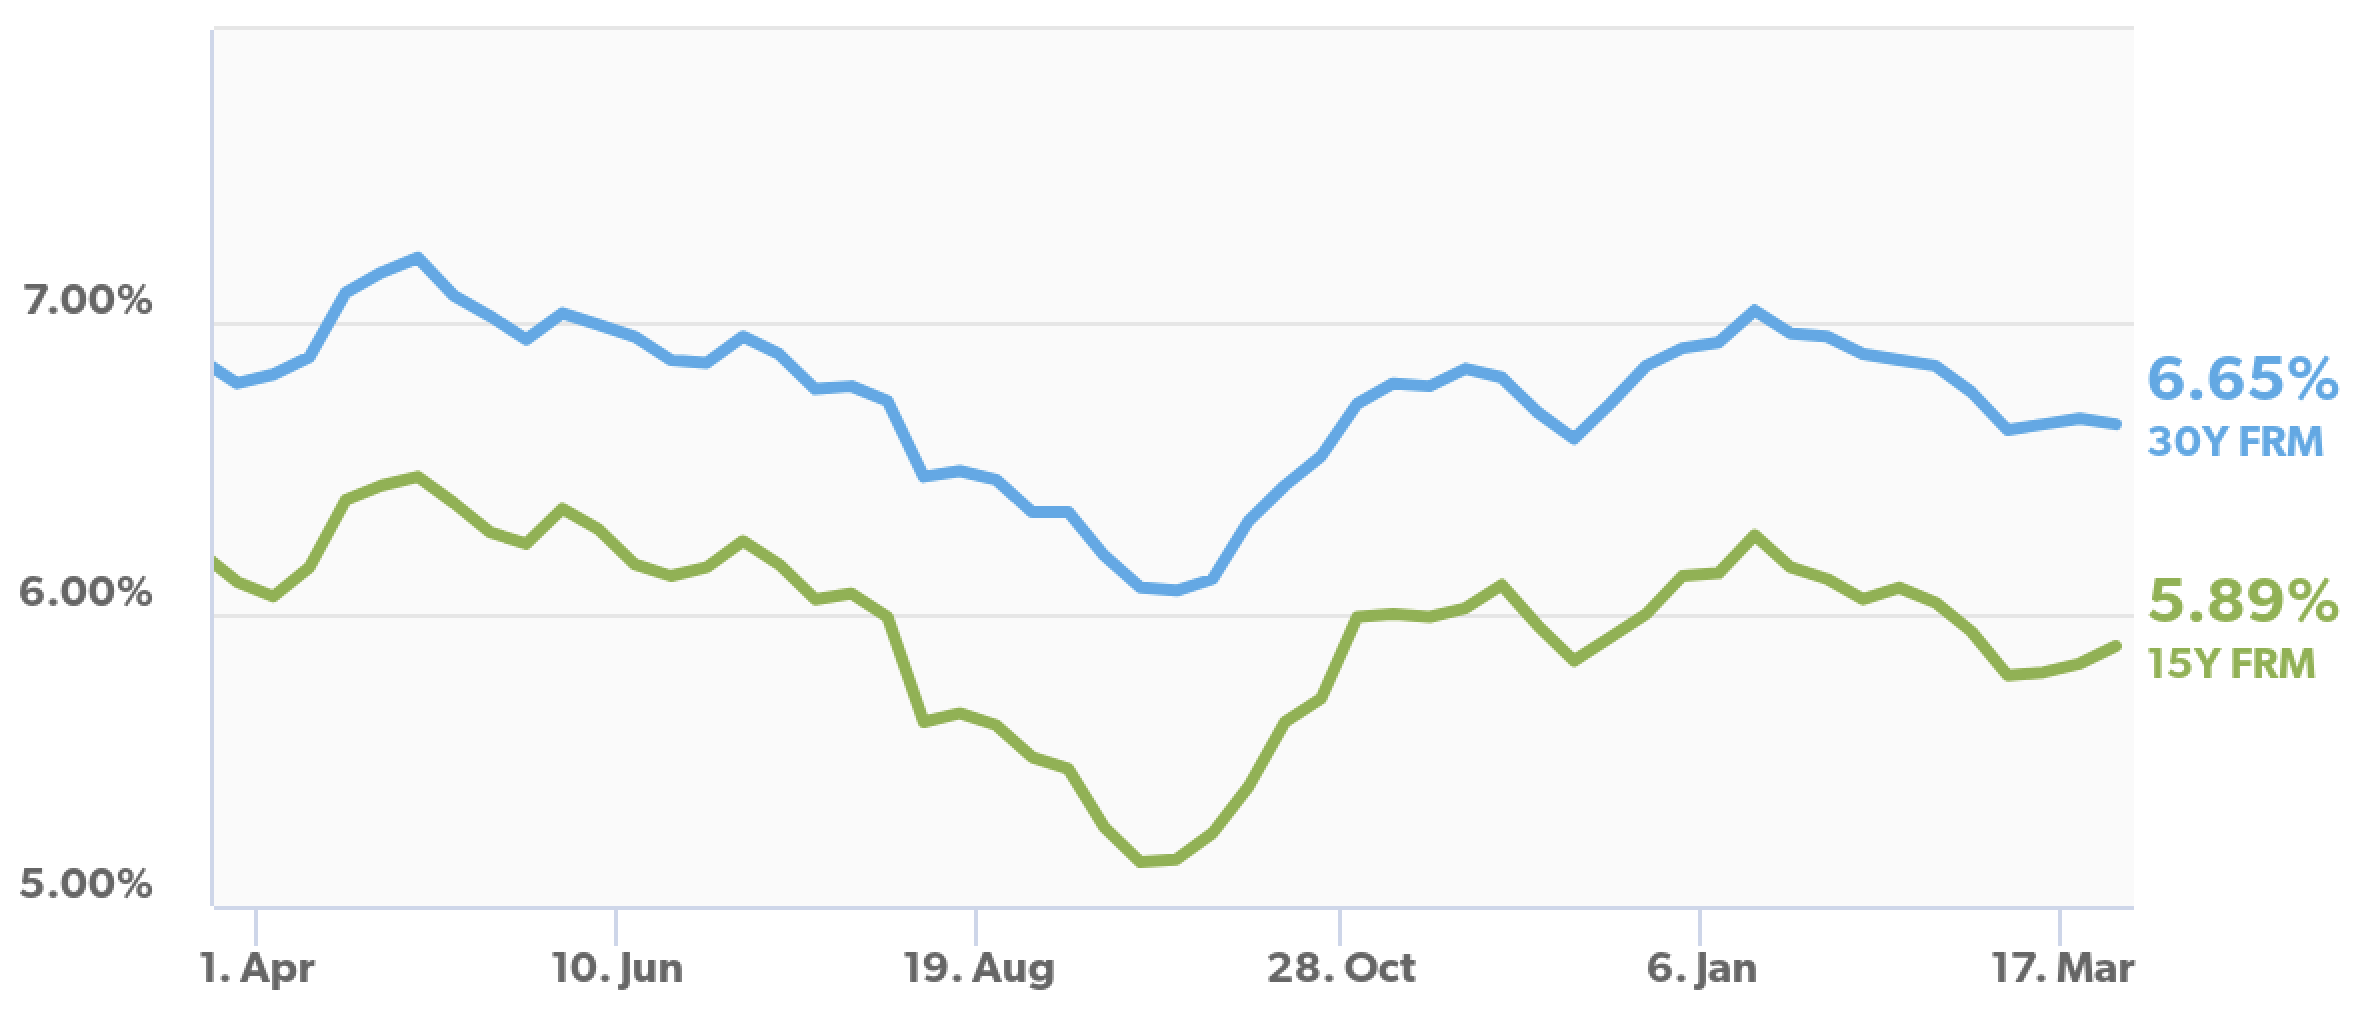
Average 30-Year Fixed Mortgage Rates over the past 12 months (Source: Freddie Mac)
Broader U.S. economy
The Fed’s Preferred Inflation Gauge Ticks Higher: The latest Personal Consumption Expenditures (PCE) report showed that headline inflation was
in line with estimates, rising 0.3% from January to February and 2.5% year-over-year. However, the core PCE rate - the Fed’s preferred measure that strips out volatile food and energy prices -was hotter than expected, up 0.4% from the prior month and 2.8% year-over-year, still stubbornly above the Fed’s 2% target. Costs for utilities, healthcare, and computer software all rose more than anticipated, contributing to the elevated inflation reading.
Pending Home Sales Improve: After two months of declines, pending home sales rose 2% from January to February, according to the National Association of REALTORS® (NAR). This metric, which tracks signed contracts on existing homes, typically precedes closings by 1-2 months and is a key indicator of housing market performance.