Market Update — April 2025

We firmly believe timely and relevant data is key to making good decisions. To this end, we are committed to providing our community and clients with actionable data and insights about the local real estate market.
Local real estate market
With the data from March 2025 in, here’s an overview of the key aspects of the local real estate market. The real estate data below is collected from Northwest Multiple Listing Service (NWMLS).
Median price: The chart below shows the latest median sales prices of homes over the past three years in the Greater Seattle area over the past three years:
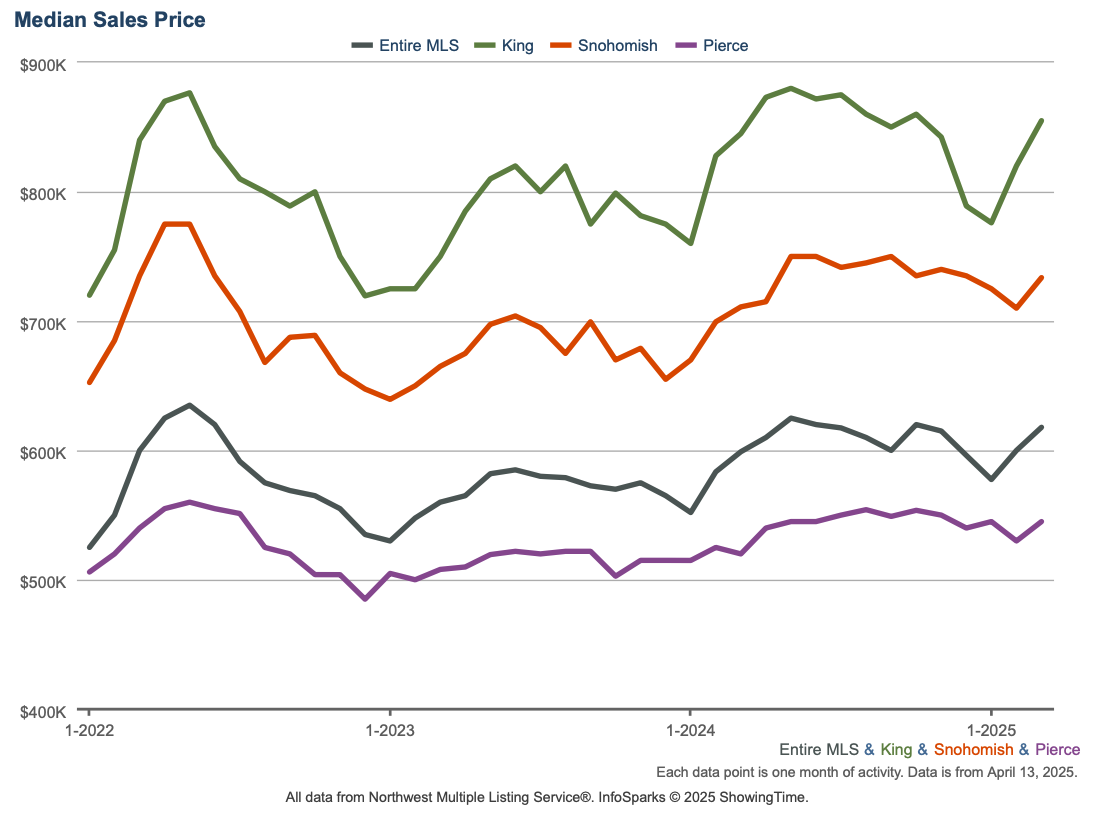
Homes sold: 5,406 homes were sold in March 2025 (up 4% compared to 5,165 in March 2024). The median price of $649,999 which represents a 2.6% increase YOY. This total sale volume translates to a dollar value of about $4.4B.
New construction: 919 new construction homes were sold in March 2025. The median sale price of new construction homes was $756,450.
Months of inventory: Given the current quantity of supply, it’ll take 2.15 months for every listed home to sell. To put this number in context, note that the months of inventory for a balanced market is considered to be 4 to 6 months. The counties with the lowest months of inventory in March 2025 were Snohomish (1.39), Pierce (1.67), Kitsap (1.86), and King (1.86). This data point indicates the persistent shortage of supply relative to demand in the area.
New listings: 9,161 new listings were added to the NWMLS database in March 2025 representing a increase of 14.1% compared to March 2024.
Mortgage rates: This month the Freddie Mac rate shows no major month-over-month change.

Primary Mortgage Market Survey — Average 30-Year Fixed Mortgage Rates over the past 12 months (Source: Freddie Mac)
Broader U.S. economy
Home Prices Maintain Solid Nationwide Growth: The closely watched Case-Shiller Home Price Index, the industry standard for measuring home value appreciation, reported a 0.6% increase in home prices across the country from December to January after seasonal adjustments. On an annual basis, home values rose 4.1% in January, building upon the 4% gain seen in December. The 10-city composite index posted a more robust 5.3% year-over-year increase, while the 20-city index saw a 4.7% rise, indicating stronger growth trends in major urban markets compared to the national average.
March Sees Stronger Job Growth, But With Caveats: March delivered a surprising upside in job growth, with 228,000 new positions added – significantly exceeding the expected 135,000 to 140,000, according to the Bureau of Labor Statistics (BLS). However, this headline figure may be subject to revision in the coming months, as January and February saw downward adjustments totaling 48,000 fewer jobs. Additionally, a closer look at the March data reveals some underlying weaknesses. The unemployment rate ticked up slightly from 4.1% to 4.2%, and average weekly earnings only increased 0.3% from February and 3.2% year-over-year – down from 3.7% in the prior report. Hours worked also remained at 34.2 for a second straight month, just above the lowest level since 2010 outside of the COVID-19 period. Furthermore, the job gains were also concentrated in specific age groups, with 20-24 year olds and those 55 and over seeing the biggest increases, while those in the prime earning ages of 25-54 actually lost 107,000 jobs.