Market Update — December 2025

We firmly believe timely and relevant data is key to making good decisions. To this end, we are committed to providing our community and clients with actionable data and insights about the local real estate market.
Local real estate market
With the data from November 2025 in, here’s an overview of the key aspects of the local real estate market. The real estate data below is collected from Northwest Multiple Listing Service (NWMLS).
Median price: The chart below shows the latest median sales prices of homes over the past 5 years in the Greater Seattle area over the past five years:
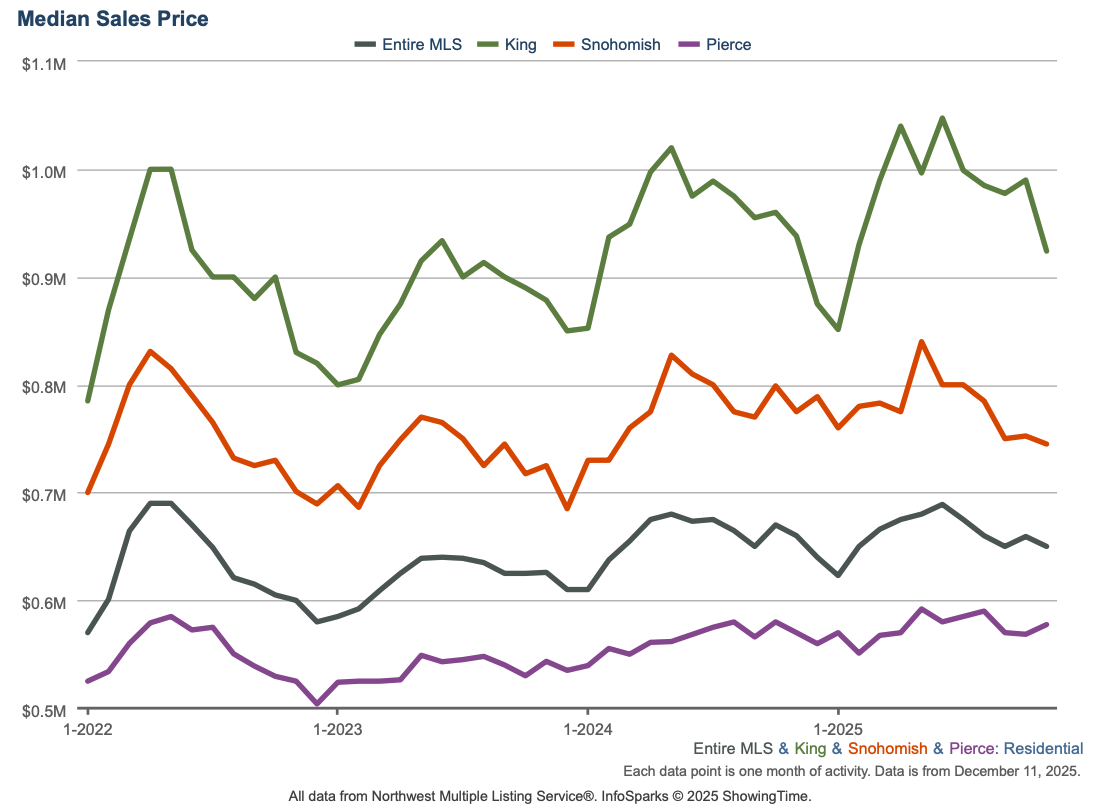
Homes sold: 4,879 homes were sold in November 2025 decreasing by 11% YOY. The median price of $630,000 which represents a decrease of 2.3% YOY. This total sale volume translates to a dollar value of about $3.75B.
New construction: 681 new construction homes were sold in November 2025. The median sale price of new construction homes was $699,900.
Months of inventory: Given the current quantity of supply, it’ll take 3.19 months for every listed home to sell. To put this number in perspective, note that the months of inventory for a balanced market is considered to be 4 to 6 months. The counties with the lowest months of inventory in November 2025 were Kitsap (2.24), Snohomish (2.28), King (2.82), and Pierce (2.85). This data point indicates the persistent shortage of supply relative to demand in the area.
New listings: 4,677 new listings were added to the NWMLS database in November 2025 representing a decrease of 2% YOY.
Mortgage rates: The Freddie Mac rate shows no significant monthly change.
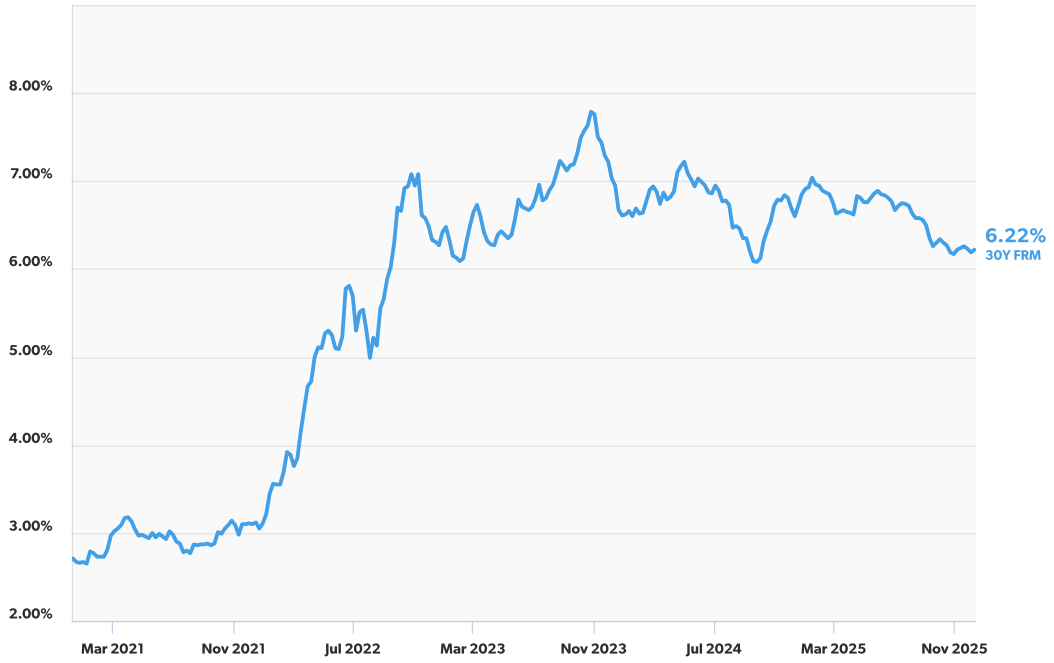
Primary Mortgage Market Survey — Average 30-Year Fixed Mortgage Rates over the past 5 years (Source: Freddie Mac)
Broader U.S. economy
PCE Inflation Data Points to Possible Rate Cut: The government released the delayed Personal Consumption Expenditures (PCE) report for September, coming mostly in line with expectations. Overall inflation rose 0.3% for the month, nudging the annual rate from 2.7% to 2.8%. Core PCE – the Fed’s preferred measure, which excludes food and energy – rose 0.2% in September and edged down slightly year-over-year from 2.9% to 2.8%, just a touch better than expected.
Additional Indicators Signal a Softer Job Market: Initial jobless claims fell by 27,000 to 191,000, though the decline was likely influenced by Thanksgiving, since many people delay filing due to travel or holiday plans. Continuing claims also dipped slightly to 1.939 million, but they have stayed above 1.9 million since mid-May, signaling ongoing strain for those already unemployed. Challenger, Gray & Christmas reported 71,000 job cut announcements in November, a 24% increase from a year ago. Restructuring was the primary driver last month, while DOGE impacts remain the leading cause of job cuts for the year. Employers have announced 1.17 million cuts year-to-date – only the sixth time since 1993 that totals through November have exceeded 1.1 million. Hiring plans are also weakening. Year-to-date hiring announcements are at their lowest level since 2010, and seasonal hiring plans are the weakest since 2012.