Market Update — January 2024

We believe timely and relevant data is key to making good decisions. To this end, we are committed to providing our community and clients with actionable data and insights about the local real estate market.
Local real estate market
With the data from December 2023 in, here’s an overview of the key aspects of the local real estate market. The real estate data below is collected from Northwest Multiple Listing Service (NWMLS).
Median price: The chart below shows the latest median sales prices of homes over the past three years in the Greater Seattle area over the past three years:

Homes sold: 4,018 homes were sold in December 2023 with the median price of $597,975, which represents a +4.9% growth YOY. This translates to a dollar value of about $3B.
New construction: 729 new construction homes were sold in December 2023. The median sale price of new construction homes was $700,000, which represents a -5.4% decline YOY.
Months of inventory: At the current rate of sales, it’ll take around 1.9 months for every listed home to sell. This indicates inventory has shrunk by about 9% YOY. To put this number in context, note that the months of inventory for a balanced market is considered to be 4 to 6 months. So the current data point confirms the enduring shortage of supply relative to demand in the area.
New listings: 2,884 new listings were added to the NWMLS database in December 2023. This is a decrease of -3.2% from December 2022, which exacerbates the low supply. This indicates fewer property owners are likely to be interested in selling their homes exacerbating the chronic shortage of supply.
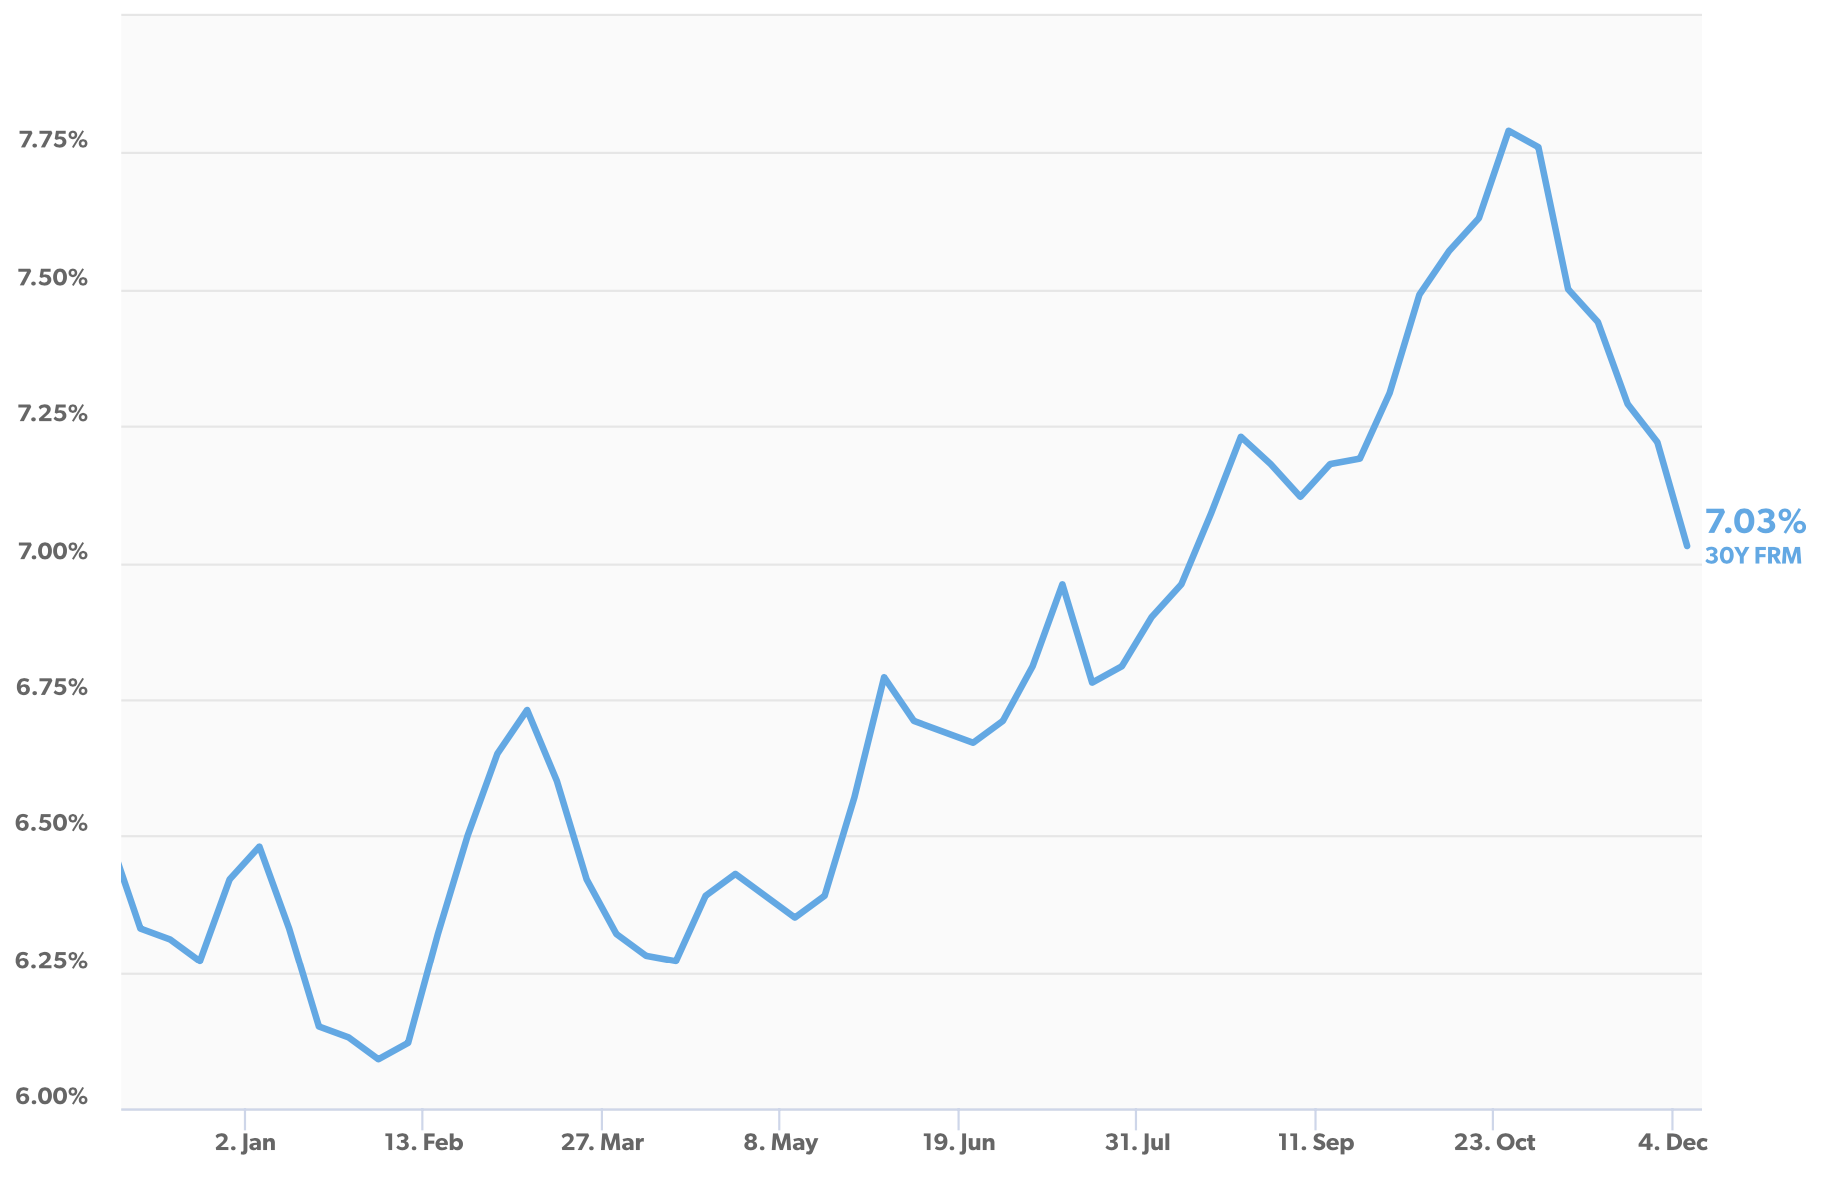
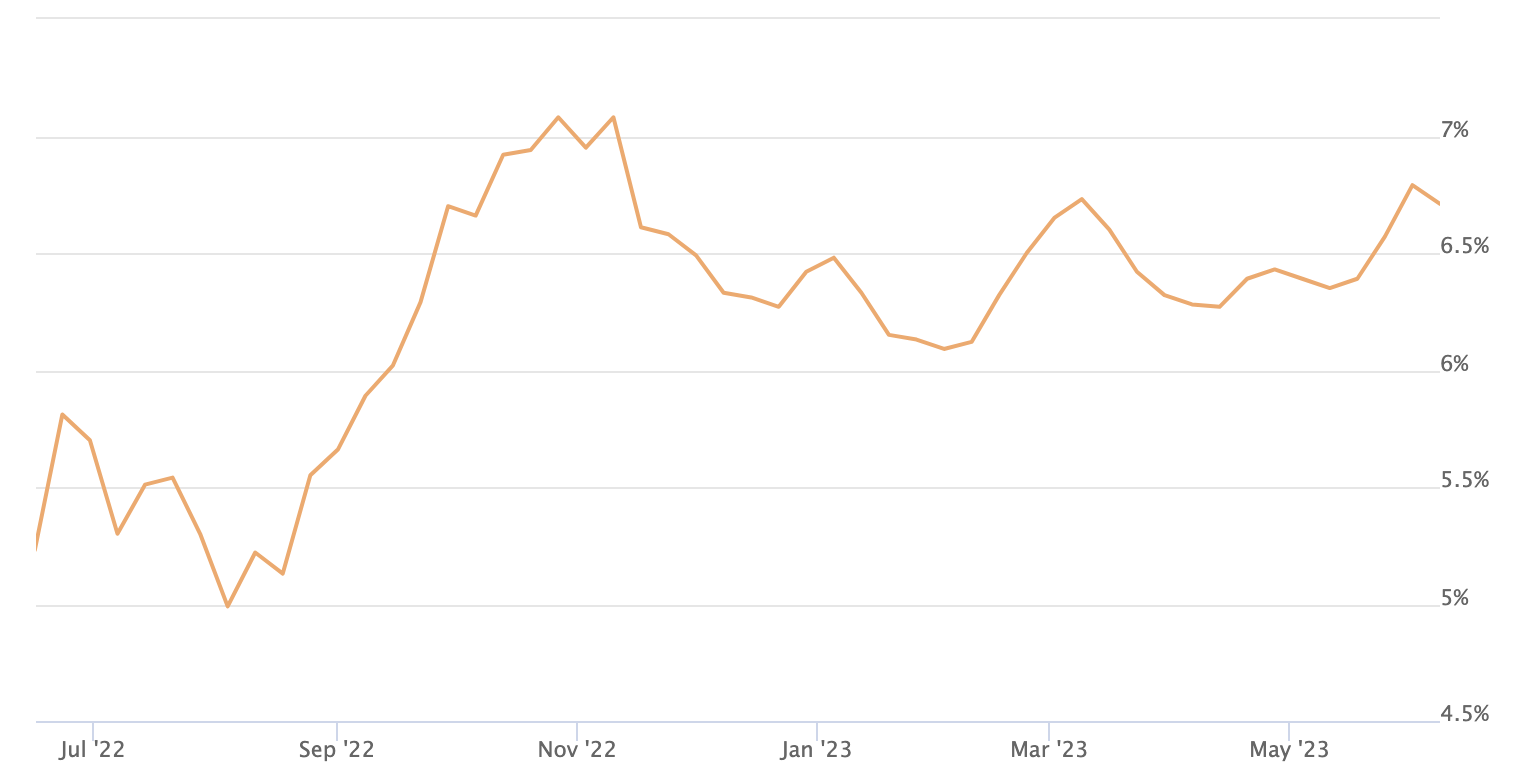
Mortgage rates: The Freddie Mac rate has edged down from it’s high in November 2023 towards 6.7%.

Average 30-Year Fixed Mortgage Rates over the past 12 months (Source: Freddie Mac)
Broader economy
Private Sector Job Growth Beats Expectations: Nela Richardson, chief economist for ADP, noted that “we’re returning to a labor market that’s very much aligned with pre-pandemic hiring.” She also explained that “while wages didn’t drive the recent bout of inflation, now that pay growth has retreated, any risk of a wage-price spiral has all but disappeared.”
“Annual “Core” Consumer Inflation Falls Below 4%: Inflation has made significant progress lower after peaking in 2022, with the headline reading now at 3.4% (down from 9.1%) and the core reading at 3.9% (down from 6.6%). Remember, the Fed began aggressively hiking the Fed Funds Rate (the overnight borrowing rate for banks) in March 2022 to try to slow the economy and curb runaway inflation. Following eleven hikes in this cycle, the Fed pressed pause at their last three meetings in 2023, as signs of cooling inflation grew. Will the progress we’ve seen on inflation be enough for the Fed to shift from rate hikes to rate cuts later this year, as many economists expect?
Market Update — December 2023
We believe timely and relevant data is key to making good decisions. To this end, we are committed to providing our community and clients with actionable data and insights about the local real estate market.
Local real estate market
With the data from November 2023 in, here’s an overview of the key aspects of the local real estate market. The real estate data below is collected from Northwest Multiple Listing Service (NWMLS).
Median price: The chart below shows the latest median sales prices of homes over the past three years in the Greater Seattle area over the past three years:

Homes sold: 4,367 homes were sold in November 2023 with the median price of $601,342 (up from $575,000 YOY). This translates to a dollar value of about $3.2B.
New construction: 704 new construction homes were sold in November 2023. The median sale price of new construction homes was $689,385.
Months of inventory: At the current rate of sales, it’ll take around 2.3 months for every listed home to sell. To put this number in context, note that the months of inventory for a balanced market is considered to be 4 to 6 months. So the current data point confirms the enduring shortage of supply relative to demand in the area.
New listings: 4,595 new listings were added to the NWMLS database in November 2023. This is a decrease of -6% from November 2022, which exacerbates the low supply. This indicates fewer property owners are likely to be interested in selling their homes exacerbating the chronic shortage of supply.
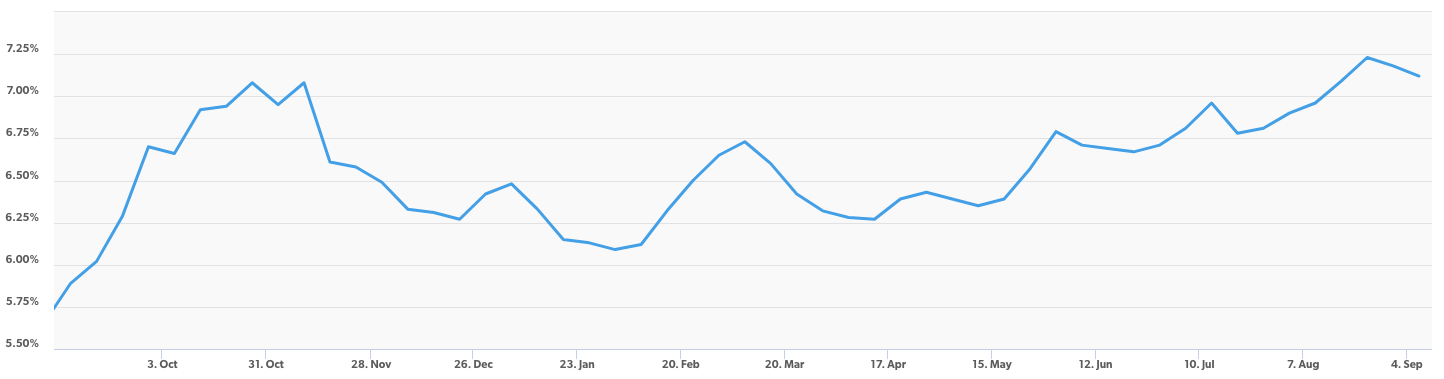
Mortgage rates: The Freddie Mac rate has edged down towards 7%.
Average 30-Year Fixed Mortgage Rates over the past 12 months (Source: Freddie Mac)
Broader economy
October’s Consumer Price Index (CPI) showed that inflation was flat compared to September, with this monthly reading coming in below the consensus estimate of a 0.1% gain. On an annual basis, CPI fell from 3.7% to 3.2%, near the lowest level in more than two years. Core CPI, which strips out volatile food and energy prices, increased 0.2% while the annual reading declined from 4.1% to 4%, reaching a two-year low. Declining gasoline and used car prices and moderating shelter costs helped keep a lid on inflation last month, even in the face of rising costs for motor vehicle and health insurance.
Market Update — November 2023
We believe timely and relevant data is key to making good decisions. To this end, we are committed to providing our community and clients with actionable data and insights about the local real estate market.
Local real estate market
With the data from October 2023 in, here’s an overview of the key aspects of the local real estate market. The real estate data below is collected from Northwest Multiple Listing Service (NWMLS).
Median price: The chart below shows the latest median sales prices of homes over the past three years in the Greater Seattle area over the past three years:

New construction: 687 new construction homes were sold in October 2023. The median sale price of new construction homes was $695,502.
Months of inventory: At the current rate of sales, it’ll take around 2 months for every listed home to sell. To put this number in context, note that the months of inventory for a balanced market is considered to be 4 to 6 months. So the current data point confirms the enduring shortage of supply relative to demand in the area.
Homes sold: 5,291 homes were sold in October 2023 with the median price of $602,000. This translates to a dollar value of about $3.9B.
New listings: 6,134 new listings were added to the NWMLS database in October 2023. This is a decrease of -15.5% from October 2022, which exacerbates the low supply. This indicates fewer property owners are likely to be interested in selling their homes exacerbating the chronic shortage of supply.
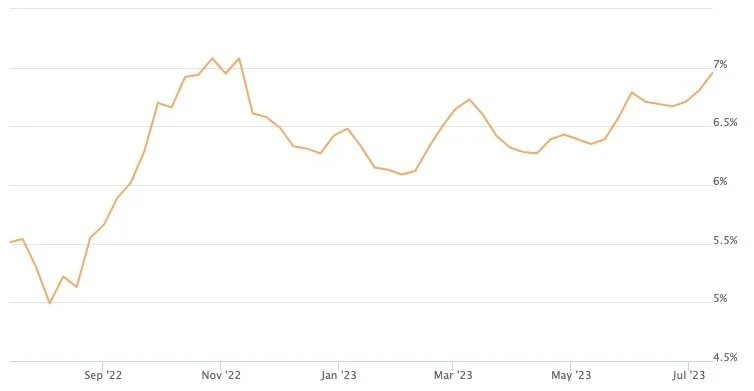
Mortgage rates: The Freddie Mac rate has been stable around 7.5%.

Average 30-Year Fixed Mortgage Rates — September 2022 to September 2023 (Source: Freddie Mac)
Broader economy
Housing Starts (which measure the start of construction on homes) rebounded in September after reaching two-year lows in August, up 7% for the month. While the bulk of the increase came in multifamily units, starts for single-family homes also rose 3.2%. Building Permits, which are indicative of future supply, did decline 4.4% from August while permits for single-family homes reached their highest level in a year.
There has been a growing chorus of Fed members who are inclined to hold rates steady at their next meeting on November 1, given the progress made toward taming inflation and tightening conditions. This includes New York Fed President John Williams, Vice Chair Michael Barr, Fed Governors Phillip Jefferson and Christopher Waller, Atlanta Fed President Raphael Bostic, San Francisco Fed President Mary Daly, Dallas Fed President Lorie Logan and Philadelphia Fed President Patrick Harker. Remember, the Fed has been hiking its benchmark Fed Funds Rate (which is the overnight borrowing rate for banks) to try to slow the economy and curb inflation.
Market Update — October 2023
We believe timely and relevant data is key to making good decisions. To this end, we are committed to providing our community and clients with actionable data and insights about the local real estate market.
Local real estate market
With the data from September 2023 in, here’s an overview of the key aspects of the local real estate market. The real estate data below is collected from Northwest Multiple Listing Service (NWMLS).
Median price: The chart below shows the latest median sales prices of homes over the past three years in the Greater Seattle area over the past three years:

New construction: 724 new construction homes were sold in September 2023. The median sale price of new construction homes was $698,866 (+2.4% MOM).
Months of inventory: At the current rate of sales, it’ll take around 2 months for every listed home to sell. To put this number in context, note that the months of inventory for a balanced market is considered to be 4 to 6 months. So the current data point confirms the enduring shortage of supply relative to demand in the area.
Homes sold: 5,722 homes were sold in September 2023 with the median price of $600,000. This translates to a dollar value of about $4.2B.
New listings: 7,551 new listings were added to the NWMLS database in September 2023. This is a decrease of -19.9% from September 2022, which exacerbates the low supply. This indicates fewer property owners are likely to be interested in selling their homes exacerbating the chronic shortage of supply.
Mortgage rates: The Freddie Mac rate has inched upward over the past month hovering just below 7.5%.

Average 30-Year Fixed Mortgage Rates — September 2022 to September 2023 (Source: Freddie Mac)
Broader economy
August’s Personal Consumption Expenditures (PCE) showed that headline inflation increased by a lower-than-expected 0.4%. The year-over-year reading rose from 3.4% to 3.5%, though the increase was due to revisions in prior reporting. Core PCE, the Fed’s preferred method which strips out volatile food and energy prices, rose by 0.1% in August with the year-over-year reading falling from 4.3% to 3.9% – the lowest level in two years.
The Fed has hiked its benchmark Fed Funds Rate (the overnight borrowing rate for banks) eleven times since March of last year to try to slow the economy and curb inflation. While inflation is still elevated, it has made a big improvement from the 7.1% peak seen last year and is now less than half that amount at 3.5% on the headline reading
Market Update — September 2023
We believe timely and relevant data is key to making good decisions. To this end, we are committed to providing our community and clients with actionable data and insights about the local real estate market.
Local real estate market
With the data from August 2023 in, here’s an overview of the key aspects of the local real estate market. The real estate data below is collected from Northwest Multiple Listing Service (NWMLS).
Median price: The chart below shows the latest median sales prices of homes over the past three years in the Greater Seattle area over the past three years:

New construction: 800 new construction homes were sold in August 2023. The median sale price of new construction homes was $682,673.
Months of inventory: At the current rate of sales, it’ll take around 1.71 months for every listed home to sell. To put this number in context, note that the months of inventory for a balanced market is considered to be 4 to 6 months. So the current data point confirms the enduring shortage of supply relative to demand in the area.
Homes sold: 6,734 homes were sold in August 2023 with the median price of $615,000. This translates to a dollar value of about $5.2B.
New listings: 8,152 new listings were added to the NWMLS database in August 2023. This is a decrease of -17.8% from August 2022, which exacerbates the low supply. This indicates fewer property owners are likely to be interested in selling their homes exacerbating the chronic shortage of supply.
Mortgage rates: The Freddie Mac rate has been stable over the past month hovering just below 7%.
Average 30-Year Fixed Mortgage Rates — September 2022 to September 2023 (Source: Freddie Mac)
Broader economy
The Case-Shiller Home Price Index, which is considered the “gold standard” for appreciation, showed home prices nationwide rose 0.7% from May to June after seasonal adjustment, marking the fifth consecutive month of gains. Prices were flat when compared to June 2022, which was when prices peaked in this report.
The Bureau of Labor Statistics (BLS) reported that there were 187,000 jobs created in August. While this was slightly better than estimates, job growth in June and July was revised lower substantially, subtracting 110,000 jobs in those months combined. The unemployment rate also rose from 3.5% to 3.8%.
Market Update — August 2023
We believe timely and relevant data is key to making good decisions. To this end, we are committed to providing our community and clients with actionable data and insights about the local real estate market.
Local real estate market
With the data from July 2023 in, here’s an overview of the key aspects of the local real estate market. The real estate data below is collected from Northwest Multiple Listing Service (NWMLS).
Median price: The chart below shows the latest median sales prices of homes over the past three years in the Greater Seattle area over the past three years:

New construction: 721 new construction homes were sold in July 2023. The median sale price of new construction homes was $705,000.
Months of inventory: At the current rate of sales, it’ll take around 1.76 months for every listed home to sell. To put this number in context, note that the months of inventory for a balanced market is considered to be 4 to 6 months. So the current data point confirms the enduring shortage of supply relative to demand in the area.
Homes sold: 6,247 homes were sold in July 2023 with the median price of $615,000. This translates to a dollar value of about $4.8B.
New listings: 8,205 new listings were added to the NWMLS database in July 2023. This is a decrease of -30.5% from July 2022, which exacerbates the low supply. This indicates fewer property owners are likely to be interested in selling their homes exacerbating the chronic shortage of supply.
Mortgage rates: The Freddie Mac rate has been stable over the past month hovering just below 7%.

Average 30-Year Fixed Mortgage Rates — August 2022 to August 2023 (Source: Freddie Mac)
Broader economy
CoreLogic’s Home Price Index showed that home prices nationwide rose for the fifth straight month, up 0.5% from May to June. Prices were also 1.6% higher when compared to June of last year. CoreLogic forecasts that home prices will rise 0.6% in July and 4.3% in the year going forward. Zillow also reported that home values have increased 4.8% this year. They’re forecasting that home values will rise 6.3% from June 2023 to June 2024, and predicting that 48 of the nation’s 200 largest markets will see increases of 7% or more.
While inflation is still elevated, it has made a big improvement from the 7% peak seen last year and is now less than half that amount at 3% on the headline reading. This welcome news not only signifies lower costs for some goods and services, but lower inflation also typically helps both Mortgage Bonds and mortgage rates improve over time.
Market Update — July 2023
We believe timely and relevant data is key to making good decisions. To this end, we are committed to providing our community and clients with actionable data and insights about the local real estate market.
Local real estate market
With the data from June 2023 in, here’s an overview of the key aspects of the local real estate market. The real estate data below is collected from Northwest Multiple Listing Service (NWMLS).
Median price: The chart below shows the latest median sales prices of homes over the past three years in the Greater Seattle area over the past three years:

New construction: 885 new construction homes were sold in June 2023. The median sale price of new construction homes was $692,755.
Months of inventory: At the current rate of sales, it’ll take around 1.5 months for every listed home to sell. To put this number in context, note that the months of inventory for a balanced market is considered to be 4 to 6 months. So the current value of around 1.5 months confirms the enduring shortage of supply relative to demand in the area.
Homes sold: 6,842 homes were sold in June 2023 with the median price of $625,000. This translates to a dollar value of $5.3B.
New listings: 9,481 new listings were added to the NWMLS database in June 2023. This is a decrease of -33.3% from June 2022, which exacerbates the low supply. This indicates fewer property owners are likely to be interested in selling their homes exacerbating the chronic shortage of supply.
Mortgage rates: The Freddie Mac rate has been slightly edging up over the past month.
Average 30-Year Fixed Mortgage Rates — July 2022 to July 2023 (Source: Freddie Mac)
Broader economy
The Bureau of Labor Statistics (BLS) reported that there were 209,000 jobs created in June, which was weaker than estimates of 240,000. Job growth in April and May was also revised lower, subtracting 110,000 jobs in those months combined. The unemployment rate declined slightly from 3.7% to 3.6%, though it’s still above April’s reading of 3.4%.
The minutes from the Fed’s June meeting showed that the Fed is planning additional hikes to their benchmark Fed Funds Rate this year. This is the interest rate for overnight borrowing for banks and it is not the same as mortgage rates. When the Fed hikes the Fed Funds Rate, they are trying to slow the economy and curb inflation.
Market Update — June 2023
We believe timely and relevant data is key to making good decisions. To this end, we are committed to providing our community and clients with actionable data and insights about the local real estate market.
Local real estate market
With the data from May 2023 in, here’s an overview of the key aspects of the local real estate market. The real estate data below is collected from Northwest Multiple Listing Service (NWMLS).
Median price: The chart below shows the latest median sales prices of homes over the past three years in the Greater Seattle area over the past three years:
New construction: 851 new construction homes were sold in May 2023. The median sale price of new construction homes was $699,995.
Months of inventory: At the current rate of sales, it’ll take around 1.5 months for every listed home to sell. To put this number in context, note that the months of inventory for a balanced market is considered to be 4 to 6 months. So the current value of around 1.5 months confirms the persistent shortage of supply relative to demand in the area.
Homes sold: 6,310 homes were sold in May 2023. This translates to a dollar value of $4.7B.
New listings: 9,427 new listings were added to the NWMLS database in May 2023. This is a decrease of -29.3% from May 2022, which exacerbates the low supply. This indicates fewer property owners are likely to be interested in selling their homes exacerbating the chronic shortage of supply.
Mortgage rates: The Freddie Mac rate shows no major change over the past month.
30 Year Fixed Mortgage Rates — June 2022 to June 2023 (Source: Freddie Mac)
Broader economy
The Bureau of Labor Statistics (BLS) reported that there were 339,000 jobs created in May, which was much larger than estimates. Job growth in March and April was also revised higher, adding 93,000 additional jobs in those months combined. The unemployment rate rose from 3.4% to 3.7%.
The Case-Shiller Home Price Index, which is considered the “gold standard” for appreciation, showed home prices nationwide rose 0.4% from February to March after seasonal adjustment. This follows the 0.3% monthly gain seen in February. Home prices were also 0.7% higher when compared to March 2022, though this annual reading is a decline from the 2.1% gain reported in February.
Private payrolls were much stronger than expected last month, as the ADP Employment Report showed that there were 278,000 jobs created in May. Annual pay for job stayers increased 6.5% and job changers saw an average increase of 12.1%. While these figures are still high, they reflect a year-long slowdown and lower wage-pressured inflation.
Market Update — May 2023
We believe timely and relevant data is key to making good decisions. To this end, we are committed to providing our community and clients with actionable data and insights about the local real estate market.
Local real estate market
With the data from April 2023 in, here’s an overview of the key aspects of the local real estate market. The real estate data below is collected from Northwest Multiple Listing Service (NWMLS).
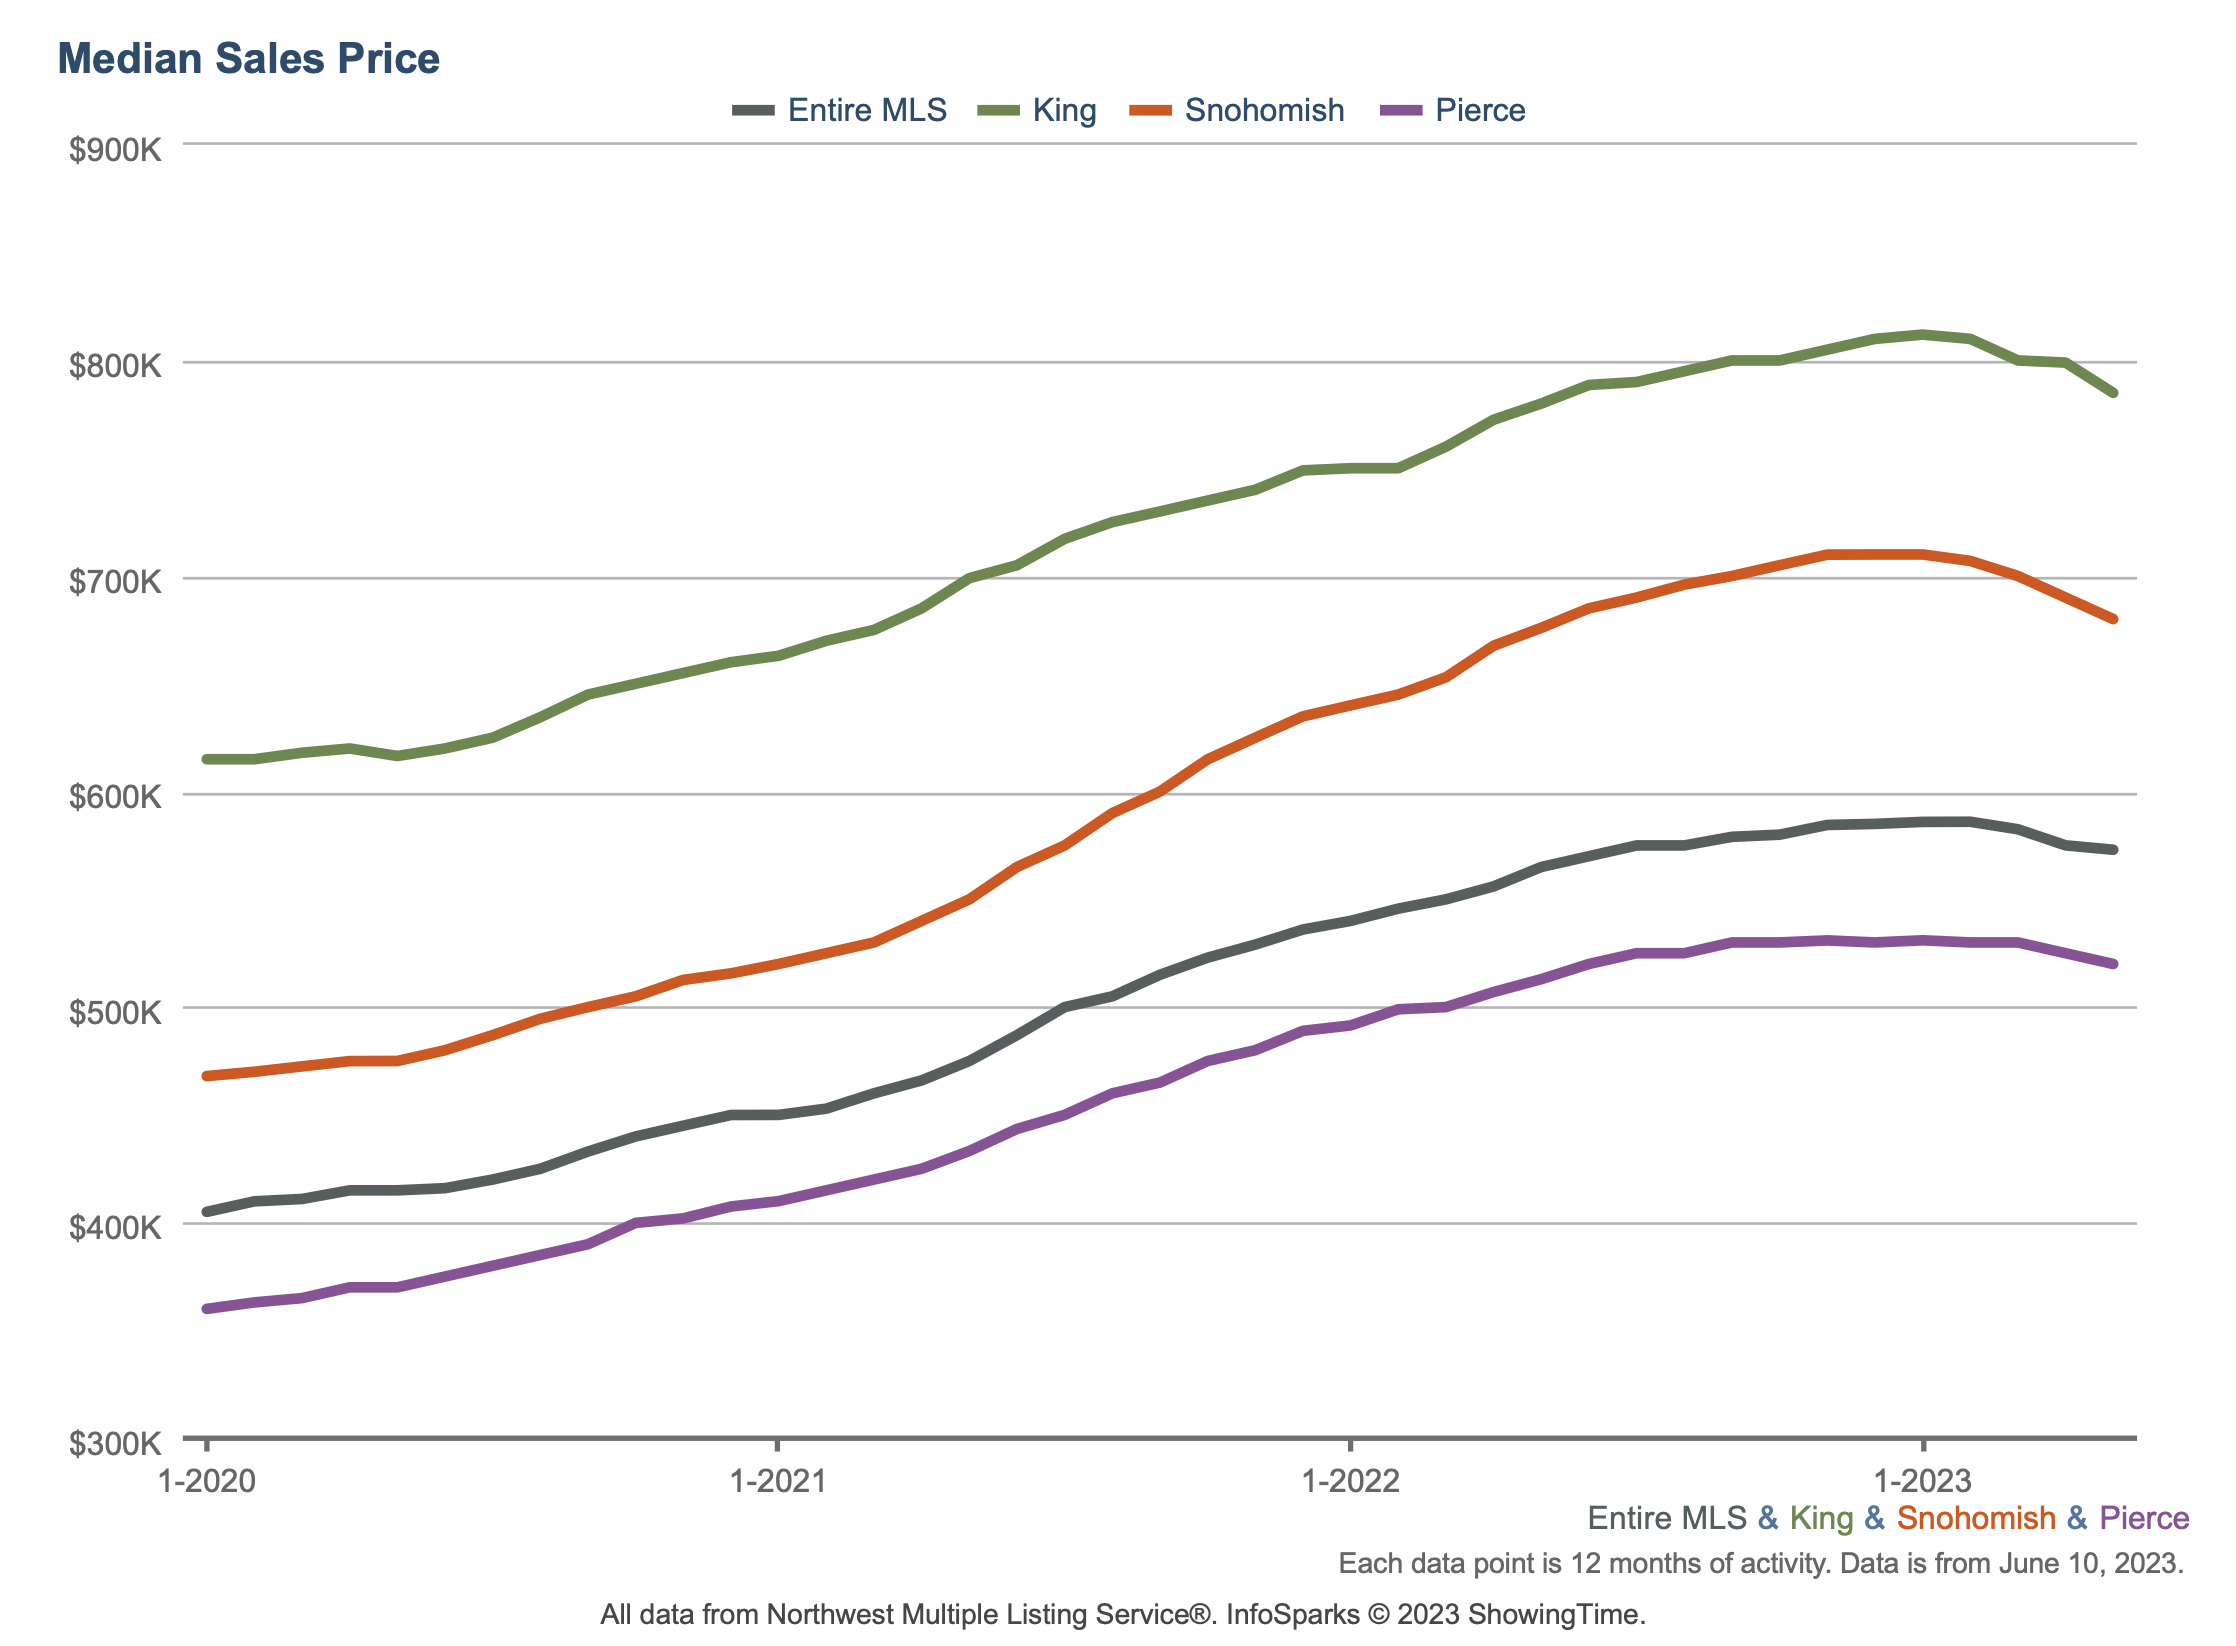
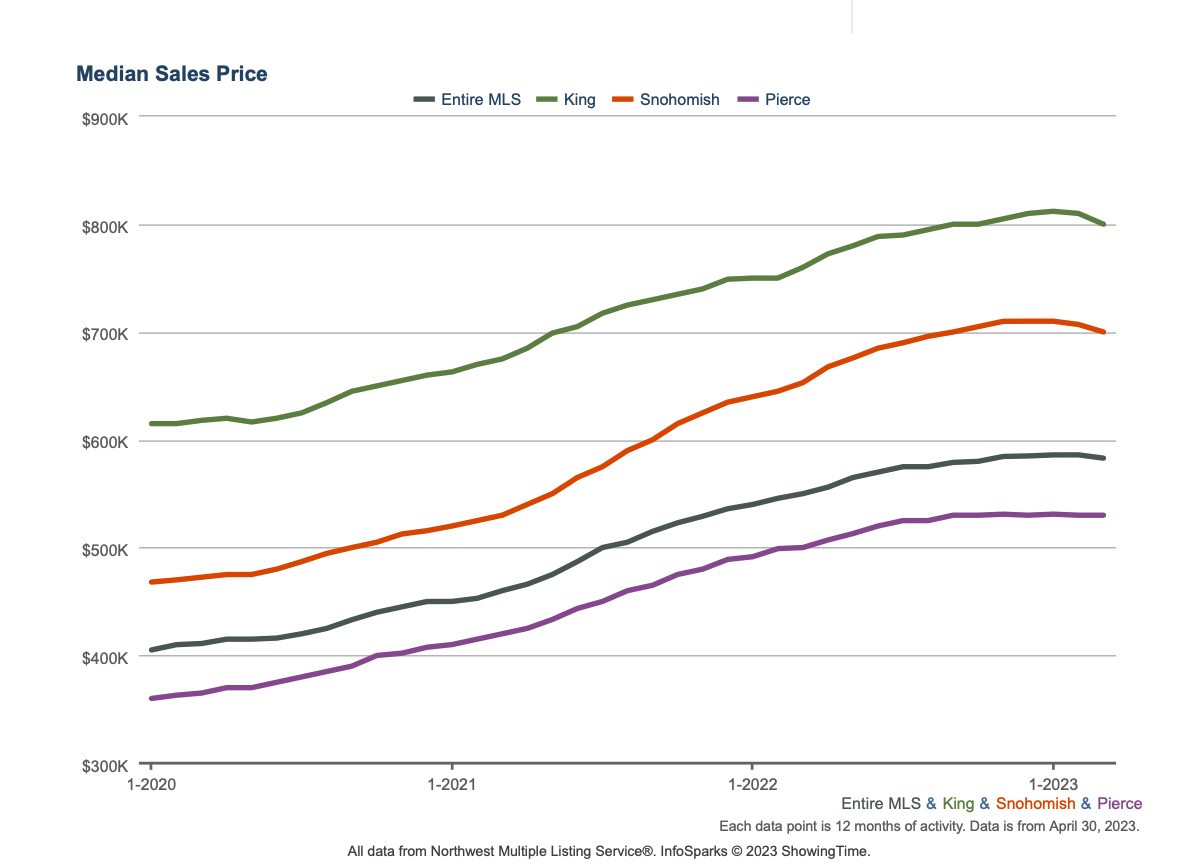
Median price: The chart below shows the latest median sales prices of homes over the past five years. Since our buyers typically buy properties in King, Snohomish, and Pierce Counties, here’s the Year-Over-Year (YOY) median closed price increase in these counties over the past 12 months:
King: +3.4%
Snohomish: +3.3%
Pierce: +3.6%
To put these numbers in perspective, S&P 500 and Nasdaq have moved by 0.9% and 5.5% YOY, respectively. Of course, to make it apples to apples when comparing investing in the stock market vs. real estate, depending on your specific scenario, you also need to account to for the impact of leverage (meaning purchasing with borrowed money) and tax benefits. Leverage and tax benefits tend to significantly increase the return on investment (ROI) for real estate relative to mere asset appreciation presented above.
And here are the median sale prices of residential properties in the Greater Seattle area over the past three years:

New construction: 754 new construction homes were sold in April 2023. The median sale price of new construction homes was $733,625.
Months of inventory: At the current rate of sales, it’ll take around 1.5 months for every listed home to sell. To put this number in context, note that the months of inventory for a balanced market is considered to be 4 to 6 months. So the current value of around 1.5 months confirms the persistent shortage of supply relative to demand in the area.
Homes sold: 5,334 homes were sold in April 2023. This translates to a dollar value of $4B.
New listings: 7,303 new listings were added to the NWMLS database in April 2023. This is a decrease of -37.5% from April 2022, which exacerbates the low supply. This indicates fewer property owners are likely to be interested in selling their homes exacerbating the chronic shortage of supply.
Mortgage rates: The Freddie Mac rate shows no major change over the past month.

30 Year Fixed Mortgage Rates — May 2022 to May 2023 (Source: Freddie Mac)
Broader economy
The Fed hiked their benchmark Fed Funds Rate by 25 basis points at their meeting last Wednesday, bringing it to a range of 5% to 5.25%.
Private payrolls nearly doubled expectations last month, as the ADP Employment Report showed that there were 296,000 jobs created in April. Annual pay for job stayers increased 6.7% and job changers saw an average increase of 13.2%. While these figures are still high, they reflect a year-long slowdown and lower wage-pressured inflation, with job-changers in particular seeing the slowest pace of pay growth since November 2021.
CoreLogic’s Home Price Index showed that home prices nationwide rose by 1.6% from February to March and they were 3.1% higher when compared to March of last year. This follows February’s 0.8% rise in home prices, suggesting that the housing market is at a turning point. CoreLogic forecasts that home prices will rise 0.8% in April and 4.6% in the year going forward, which is an upward revision from 3.7% in February’s report.
Market Update — April 2023
We believe timely and relevant data is key to making good decisions. To this end, we are committed to providing our community and clients with actionable data and insights about the local real estate market.
Local real estate market
With the data from March 2023 in, here’s an overview of the key aspects of the local real estate market. The real estate data below is collected from Northwest Multiple Listing Service (NWMLS).
Median price: The chart below shows the latest median sales prices of homes over the past five years. Since our buyers typically buy properties in King, Snohomish, and Pierce Counties, here’s the Year-Over-Year (YOY) median closed price increase in these counties over the past 12 months:
King: +5.2%
Snohomish: +7.2%
Pierce: +5.7%
To put these numbers in perspective, S&P 500 and Nasdaq have moved by 0.1% and 0.6% YOY, respectively.
And here are the median sold prices of residential properties in the Greater Seattle area over the past three years:
New construction: 1,050 new construction homes were sold in March 2023. The median sale price of new construction homes was $699,990.
Months of inventory: At the current rate of sales, it’ll take more than one month for every listed home to sell. To put this number in context, note that the months of inventory for a balanced market is considered to be 4 to 6 months. So the current value of around 1 confirms the persistent shortage of supply relative to demand in the area.
Homes sold: 5,817 homes were sold in March 2023. This translates to a dollar value of $4.2B.
New listings: 7,904 new listings were added to the NWMLS database in March 2023. This is a decrease of -29% from March 2022, which exacerbates the low supply. This indicates fewer property owners are interested in selling their homes exacerbating the chronic shortage of supply.
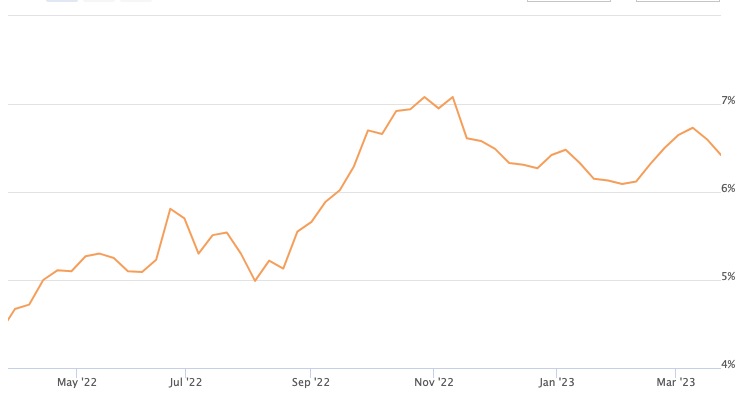
Mortgage rates: The Freddie Mac rate showed a 30 basis point decrease from mid-March 2023 to mid-April 2023. The market is awaiting the Fed decision on the base rate in May.

30 Year Fixed Mortgage Rates — April 2022 to April 2023 (Source: Freddie Mac)
Broader economy
Initial Jobless Claims continued to move higher this month, with the number of people filing for unemployment benefits for the first time rising by 5,000 in the latest week to 245,000. This tied the third highest reading so far this year. Continuing Jobless Claims also surged to 1.865 million, up 61,000.
The Conference Board released their Leading Economic Index (LEI) for March, which was down 1.2%, falling to “its lowest level since November of 2020, consistent with worsening economic conditions ahead,” said Justyna Zabinska-La Monica, Senior Manager, Business Cycle Indicators. This report is a composite of economic indexes and can signal peaks and troughs in the business cycle.
Market Update — March 2023
We believe timely and relevant data is key to making good decisions. To this end, we are committed to providing our community and clients with actionable data and insights about the local real estate market.
Local real estate market
With the data from February 2023 in, here’s an overview of the key aspects of the local real estate market. The real estate data below is collected from Northwest Multiple Listing Service (NWMLS).
Median price: The chart below shows the latest median sales prices of homes over the past five years. Since our buyers typically buy properties in King, Snohomish, and Pierce Counties, here’s the Year-Over-Year (YOY) median closed price increase in these counties over the past 12 months:
King: +8%
Snohomish: +9.5%
Pierce: +6.2%
To put these numbers in perspective, S&P 500 and Nasdaq have moved by -6.2% and 1.7% YOY, respectively.
And here are the median sold prices of residential properties in the Greater Seattle area over the past three years:

New construction: 737 new construction homes were sold in February 2023. The median sale price of new construction homes was $710,000.
Months of inventory: At the current rate of sales, it’ll take 1.5 months for every listed home to sell. To put this number in context, note that the months of inventory for a balanced market is considered to be 4 to 6 months. So the current value of 1.5 confirms the persistent shortage of supply relative to demand in the area.
Homes sold: 4,258 homes were sold in February 2023. This translates to a dollar value of $2.9B.
New listings: 5,231 new listings were added to the NWMLS database in February 2023. This is a decrease of -34% from February 2022, which exacerbates the low supply. This indicates fewer property owners are interested in selling their homes exacerbating the chronic shortage of supply.
Mortgage rates: The Fed hiked its benchmark Fed Funds Rate by 25 basis points (meaning 0.25%) at its meeting earlier this month, marking the ninth hike since March 2022 and bringing it to a range of 4.75% to 5%. The Fed Funds Rate is the interest rate for overnight borrowing for banks and it is not the same as mortgage rates. When the Fed hikes the Fed Funds Rate, they are trying to slow the economy and curb inflation.
30 Year Fixed Mortgage Rates — March 2022 to March 2023 (Source: Freddie Mac)
Broader economy
Nationally, home sales rose 14.5% from January to February to a 4.58 million unit annualized pace, per the National Association of Realtors (NAR), coming in much stronger than estimates and ending twelve consecutive months of declines. Sales were 22.6% lower than they were in February of last year, though this is less than the nearly 37% annual decline seen in January. This report measures closings on existing homes, which represent around 90% of the market, making it a critical gauge for taking the pulse of the housing sector.
February’s data showed signs of strength in the housing market, despite media headlines to the contrary. For example, while there was a 0.2% decline in the median home price to $363,000 from a year earlier, this is not the same as a decline in home prices as some reports implied. The median home price simply means half the homes sold were above that price and half were below it, and this figure can be skewed by the mix of sales among lower-priced and higher-priced homes. Real appreciation data per the la
Market Update — February 2023
We believe timely and relevant data is key to making good decisions. To this end, we are committed to providing our community and clients with actionable data and insights about the local real estate market.
Local real estate market
With the data from January 2023 in, here’s an overview of the key aspects of the local real estate market. The real estate data below is collected from Northwest Multiple Listing Service (NWMLS).
Median price: The chart below shows the latest median sales prices of homes over the past five years. Since our buyers typically buy properties in King, Snohomish, and Pierce Counties, here’s the Year-Over-Year (YOY) median closed price increase in these counties over the past 12 months:
King: +8.3%
Snohomish: +10.9%
Pierce: +8.1%
To put these numbers in perspective, S&P 500 and Nasdaq have moved by -8% and -3.4% YOY, respectively.
And here are the median sold prices of residential properties in the Greater Seattle area over the past three years:

New construction: 488 new construction homes were sold in January 2023. The median sale price of new construction homes was $735,990.
Months of inventory: At the current rate of sales, it’ll take 2.5 months for every listed home to sell. To put this number in context, note that the months of inventory for a balanced market is considered to be 4 to 6 months. So the current value of 2.5 confirms the persistent shortage of supply relative to demand in the area.
Homes sold: 3,264 homes were sold in January 2023. This translates to a dollar value of $2.18B.
New listings: 4,925 new listings were added to the NWMLS database in January 2023. This is a decrease of -16.9% from January 2022, which exacerbates the low supply. This indicates fewer property owners are interested in selling their homes exacerbating the chronic shortage of supply.
Mortgage rates: Mortgage rates have climbed down from their peak in October 2022 and edged lower since January 2023. The majority of January was characterized by sharp decline in mortgage rate volatility and the lowest rates in several months, the first week of February has done its best to erase that progress. This is a process that began in earnest after last week's jobs report, but it continued into the current week. Part of the reason for yesterday's move toward higher rates was the market's anticipation for today's comments from Fed Chair Powell. Buying down rates remains a popular strategy for buyers to lock in lower rates.

30 Year Fixed Mortgage Rates — February 2022 to February 2023 (Source: Freddie Mac)
Broader economy
Are More Fed Rate Hikes Ahead This Year? As expected, the Fed hiked its benchmark Fed Funds Rate by 25 basis points at its meeting last Wednesday. The Fed has now hiked the Fed Funds Rate eight times since last March, bringing it to a range of 4.5% to 4.75%. The Fed Funds Rate is the interest rate for overnight borrowing for banks and it is not the same as mortgage rates. When the Fed hikes the Fed Funds Rate, they are trying to slow the economy and curb inflation.
Fed Chair Jerome Powell acknowledged that inflation has been declining, which he noted was encouraging. However, he said the Fed has more work to do to ensure inflation is on a sustained downward path. He emphasized that the Fed would continue to make their “decisions meeting by meeting, taking into account the totality of incoming data and their implications for the outlook for economic activity and inflation.”
Market Update — January 2023
“The first step towards getting somewhere is to decide that you are not going to stay where you are.”
We believe timely and relevant data is key to making good decisions. To this end, we are committed to providing our community and clients with actionable data and insights about the local real estate market.
Local real estate market
With the data from December 2022 in, here’s a snapshot of the key aspects of the local market. The data is collected from Northwest Multiple Listing Service (NWMLS).
Median price: The chart below shows the median sales prices of homes over the past five years. Since our buyers typically buy properties in King, Snohomish, and Pierce Counties, here’s the YOY median closed price increase in these counties over the past 12 months:
King: +8.1%
Snohomish: +11.8%
Pierce: +8.4%
To put these numbers in perspective, note that S&P 500 and Nasdaq have moved by -19.4% and -12.8%, respectively.
And here are the median sold prices of residential properties over the past three years:

New construction: 726 new construction homes were sold in December 2022. The median sale price of new construction homes was $740,000.
Months of inventory: At the current rate of sales, it’ll take 2 months for every listed home to sell. To put this number in context, note that the months of inventory for a balanced market is considered to be 4 to 6 months. So the current value of 2 indicates the persistent shortage of supply relative to demand.
Homes sold: 4,524 homes were sold in December 2022. This translates to a dollar value of $3.11B.
New listings: 2,980 new listings were added to the NWMLS database in December 2022. This is a decrease of -35.5% from December 2021. This indicates fewer property owners are interested in selling their homes exacerbating the chronic shortage of supply.
Mortgage rates: Mortgage rates have climbed down from their peak in October 2022. Buying down rates remains a popular strategy for buyers to lock in lower rates.

30 Year Fixed Mortgage Rates — January 2022 to January 2023 (Source: Freddie Mac)
Broader economy
Consumer Inflation Continues to Ease: The Consumer Price Index (CPI), which measures inflation on the consumer level, showed that inflation decreased by 0.1% in December. 2022 On an annual basis, inflation declined from 7.1% to 6.5%. Core CPI, which strips out volatile food and energy prices, rose 0.3%. As a result, year-over-year Core CPI decreased from 6% to 5.7%. All of these figures were in line with estimates.
Market Update — December 2022
The latest local market data suggests that despite seasonal slowdown, there is pent-up demand for housing. With the data from November 2022 in, here’s a snapshot of the key aspects of the local market. The data is collected from Northwest Multiple Listing Service (NWMLS):
Median price: The median closed price for residential homes and condos increased by 0.9% year over year (YOY) to $575,000. Since our buyers typically buy properties in King, Snohomish, and Pierce Counties, here’s the YOY median closed price increase in these counties:
King: +8.8%
Snohomish: +13.6%
Pierce: +10.1%
To put these numbers in perspective, note that S&P 500 and Nasdaq have moved by -15.6% and -30.1%, respectively.
New construction: 683 new construction homes were sold in November 2022. The median sale price of new construction homes was $690,000, which is down by 0.5% since November 2021.
Months of inventory: At the current rate of sales, it’ll take 2.36 months for every listed home to sell. This number was 0.51 in November 2021. To put these numbers in context, note that the months of inventory for a balanced market is considered to be 4 to 6 months. This indicates the persistent shortage of supply relative to demand. It seems the market is inching toward stability although homes are still under-supplied.
Homes sold: 5,194 homes were sold in November 2022. This translates to a dollar value of $3.68B.
New listings: 4,890 new listings were added to the NWMLS database in November 2022. This is a decrease of -24.2% from November 2021.
Buyers insights: While interest rates are going up, two factors help counter higher rates
More lenders are now offering temporary rate buy-down options. This helps buyers to tide over the next couple of years before a potential refinance.
Home prices are growing at a slower pace, which gives a typical buyer more power than they had over the last few years.
Market Update — November 2022
Investing in real estate in Snohomish, Pierce, and King counties continues to deliver strong results even while the broader economy is struggling. With the data from October 2022 in, here’s a snapshot of the key aspects of the local market. The data is collected from Northwest Multiple Listing Service (NWMLS):
Median price: The median closed price for residential homes and condos increased by 3.5% year over year (YOY) to $59523,000. Since our buyers typically buy properties in King, Snohomish, and Pierce Counties, here’s the YOY median closed price increase in these counties:
King: +8.8%
Snohomish: +25%
Pierce: +11.8%
To put these numbers in perspective, note that S&P 500 and Nasdaq have moved by -15.2% and -7.5%, respectively.
New construction: 688 new construction homes were sold in October 2022. The median sale price of new construction homes was $699,994, which is up by 0.1% since October 2021.
Months of inventory: At the current rate of sales, it’ll take 2 months for every listed home to sell. This number was 0.66 in October 2021. To put these numbers in context, note that the months of inventory for a balanced market is considered to be 4 to 6 months. This underscores the persistent shortage of supply relative to demand. It seems the market is inching toward stability although homes are still under-supplied.
Homes sold: 6,464 homes were sold in October 2022. This translates to a dollar value of $4.68B.
New listings: 7,260 new listings were added to the NWMLS database in October 2022. This is a decrease of -21.2% from October 2021.
Buyers insights: While interest rates are going up, two factors help counter higher rates
More lenders are now offering temporary rate buy-down options. This helps buyers to tide over the next couple of years before a potential refinance.
Home prices are growing at a slower pace, which gives a typical buyer more power than they had over the last few years.
Market Update — October 2022
With the data from September 2022 in, here’s a snapshot of the key aspects of the local market. The data is collected from Northwest Multiple Listing Service (NWMLS):
Median price: The median closed price for residential homes and condos increased by 5.1% year over year (YOY) to $599,000. Since our buyers typically buy properties in King, Snohomish, and Pierce Counties, here’s the YOY median closed price increase in these counties:
King: +9.6%
Snohomish: +16.7%
Pierce: +14%
As a couple of points of reference from an investment perspective, note that S&P 500 and Nasdaq have moved by -12.6% and -23.7%, respectively.
New construction: 788 new construction homes were sold in September 2022. The median sale price of new construction homes was $749,950, which is up by 12% since September 2021.
Months of inventory: At the current rate of sales, it’ll take 2 months for every listed home to sell. This number was 0.75 in September 2021. To put these numbers in context, note that the months of inventory for a balanced market is considered to be 4 to 6 months. This underscores the persistent shortage of supply relative to demand. It seems the market is inching toward stability although homes are still under-supplied.
Homes sold: 7,504 homes were sold in September 2022. This translates to a dollar value of $5.45B.
New listings: 9,422 new listings were added to the NWMLS database in September 2022. This is a decrease of -17.2% from September 2021.
Takeaway: What we see in the market is that despite the slowing demand due to higher interest rates, property prices continue to rise, albeit at a slower rate. But why is that? The main reason is the tight supply: In addition to the chronic shortage of homes in the local market, the slower rate of home price increase has driven a portion of potential sellers to hold off, which has in turn driven the supply even lower than usual.
Buyers insights: While interest rates are going up, two factors help counter higher rates
More lenders are now offering temporary rate buy-down options. This helps buyers to tide over the next couple of years before a potential refinance.
Home prices are growing at a slower pace, which gives a typical buyer more power than they had over the last few years.
Market Update — September 2022
With the data from August 2022 in, here’s a snapshot of the key aspects of the local market. The data is collected from Northwest Multiple Listing Service (NWMLS):
Median price: The median closed price for residential homes and condos increased by 3.6% year over year (YOY) to $600,000. Since our buyers typically buy properties in King, Snohomish, and Pierce Counties, here’s the YOY median closed price increase in these counties:
King: +9.7%
Snohomish: +17.7%
Pierce: +14.1%
As a couple of points of reference from an investment perspective, note that S&P 500 and Nasdaq have moved by -11.1% and -12.1%, respectively.
New construction: 726 new construction homes were sold in August 2022. The median sale price of new construction homes was $738,950, which is up by 6.3% since August 2021.
Months of inventory: At the current rate of sales, it’ll take 1.84 months for every listed home to sell. This number was 0.7 in August 2021. To put these numbers in context, note that the months of inventory for a balanced market is considered to be 4 to 6 months. This underscores the persistent shortage of supply relative to demand. It seems the market is inching toward stability although homes are still under-supplied.
Homes sold: 7,998 homes were sold in August 2022. This translates to a dollar value of $5.94B.
New listings: 9,914 new listings were added to the NWMLS database. This is a decrease of -13.3% from August 2021.
Similar to what we saw back in August 2022, the observation here is that buyers might still have to compete with other would-be homeowners, and depending on the property, some sellers are receiving offers over their asking price.
Buyers insights: While interest rates are going up, two factors help counter higher rates
More lenders are now offering temporary rate buy-down options. This helps buyers to tide over the next couple of years before a potential refinance.
Home prices are growing at a slower pace, which gives a typical buyer more power than they had over the last few years.
Market Update — August 2022
With the data from July 2022 in, here’s a snapshot of the key aspects of the local market. The data is collected from Northwest Multiple Listing Service (NWMLS):
Median price: The median closed price for residential homes and condos increased by 6.1% year over year (YOY) to $625,000. Since our buyers typically buy properties in King, Snohomish, and Pierce Counties, here’s the YOY median closed price increase in these counties:
King: 10.1%
Snohomish: 20%
Pierce: 16.7%
New construction: 679 new construction homes were sold in July 2022. The median sale price of new construction homes was $809,000, which is up by 19.5% since July 2021.
Months of inventory: At the current rate of sales, it’ll take 2.01 months for every listed home to sell. This number was 0.73 in July 2021. To put these numbers in context, note that the months of inventory for a balanced market is considered to be 4 to 6 months. This underscores the persistent shortage of supply relative to demand. It seems the market is inching toward stability although homes are still under-supplied.
Homes sold: 7,645 homes were sold in July 2022. This translates to a dollar value of $5.86B.
New listings: 11,805 new listings were added to the NWMLS database. This is a decrease of -8.6% from July 2021.
The observation from the field is that buyers still have to compete with other would-be homeowners, and depending on the property, some sellers are receiving offers over their asking price.
Market Update — July 2022
With the data from June 2022 in, let’s go over some key aspects of the market. The data is collected from Northwest Multiple Listing Service (NWMLS):
Median price: The median closed price for residential homes and condos increased by 10.4% year over year (YOY) to $650,000. Since our buyers typically buy properties in King, Snohomish, and Pierce Counties, here’s the YOY median closed price increase in these counties:
King: 12%
Snohomish: 21.7%
Pierce: 16.7%
New construction: 763 new construction homes were sold in June 2022. The median sale price of new construction homes was $756,650, which is up by 11.7% since June 2021.
Months of inventory: At the current rate of sales, it’ll take 1.48 months for every listed home to sell. This number was 0.58 in June 2021. To put these numbers in context, note that the months of inventory for a balanced market is considered to be 4 to 6 months. This underscores the persistent shortage of supply relative to demand.
Homes sold: 9,047 homes were sold in June 2022. This translates to a dollar value of $7.25B.
New listings: 14,223 new listings were added to the NWMLS database. This is an increase of 8.5% from June 2021.
Compared to a year ago, we see a healthy jump in inventory, double-digit drops in both pending and closed sales, and the smallest year-over-year (YOY) increase in prices since June 2020.
What does it mean in practical terms? The data shows signs of creating opportunities for buyers. In my own experience, for the first time in a few years, I see now my buyers are able to ask for a (minimal) price reduction, which would have been unthinkable for the most of 2020 and 2021.
Market Update — June 2022

With the data from May 2022 in, let’s go over some key aspects of the market. The data is collected from Northwest Multiple Listing Service (NWMLS):
Median price: The median closed price for residential homes and condos increased by 12.8% year over year (YOY) to $660,000.
New construction: 910 new construction homes were sold in May 2022. The median sale price of new construction homes was $770,228, which is up by 15% since May 2021.
Months of inventory: At the current rate of sales, it’ll take 0.97 months for every listed home to sell. This number was 0.59 in May 2021. To put these numbers in context, note that the months of inventory for a balanced market is considered to be 4 to 6 months. This underscores the persistent shortage of supply relative to demand.
Homes sold: 9,096 homes were sold in May 2022. This translates to a dollar value of $7.44B.
New listings: 13,075 new listings were added to the NWMLS database. This is an increase of 9.7% from May 2021.
To summarize, the market continues to face an upward price trend, which is driven in large part by a shortage of supply.