Market Update — September 2025

We firmly believe timely and relevant data is key to making good decisions. To this end, we are committed to providing our community and clients with actionable data and insights about the local real estate market.
Local real estate market
With the data from August 2025 in, here’s an overview of the key aspects of the local real estate market. The real estate data below is collected from Northwest Multiple Listing Service (NWMLS).
Median price: The chart below shows the latest median sales prices of homes over the past 5 years in the Greater Seattle area over the past five years:

Homes sold: 6,341 homes were sold in August 2025 decreasing by 5.7% YOY. The median price of $650,000 which represents a slight increase of 0.8% YOY. This total sale volume translates to a dollar value of about $5.2B.
New construction: 742 new construction homes were sold in August 2025. The median sale price of new construction homes was $738,713.
Months of inventory: Given the current quantity of supply, it’ll take 3.19 months for every listed home to sell. To put this number in perspective, note that the months of inventory for a balanced market is considered to be 4 to 6 months. The counties with the lowest months of inventory in August 2025 were Kitsap (2.13), Snohomish (2.38), Thurston (2.54), Pierce (2.58), and King (2.86). This data point indicates the persistent shortage of supply relative to demand in the area.
New listings: 8,730 new listings were added to the NWMLS database in August 2025 representing a decrease of 2.4% compared to August 2024.
Mortgage rates: This month the Freddie Mac rate shows a quarter-point decrease month-over-month.
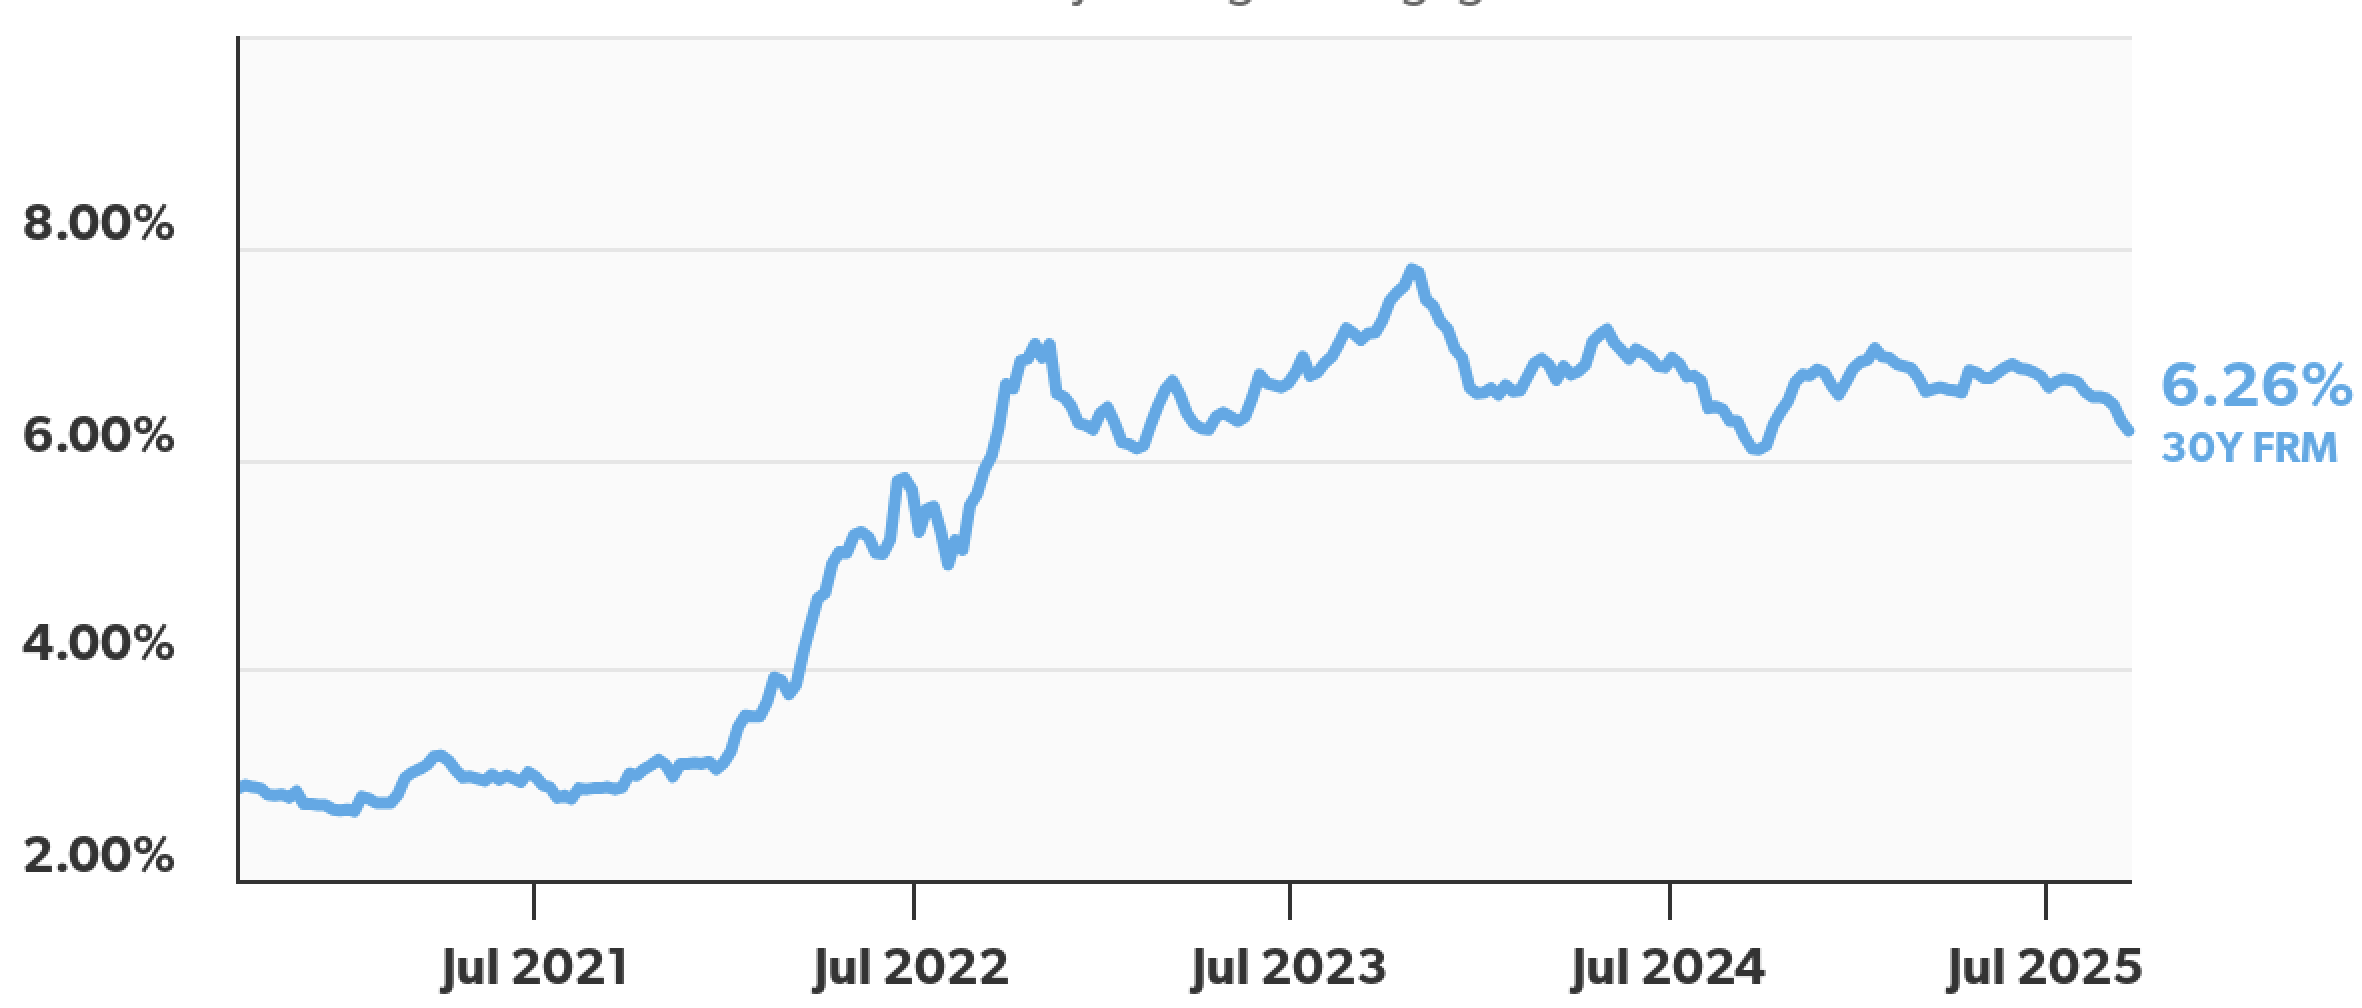
Primary Mortgage Market Survey — Average 30-Year Fixed Mortgage Rates over the past 5 years (Source: Freddie Mac)
Broader U.S. economy
Jobless Claims Jump to 4-Year High: Initial jobless claims rose by 27,000 to 263,000 – the highest since 2021 and above expectations. Continuing claims, which track people still receiving unemployment benefits after the first week, held steady at 1.939 million. The sharp rise in new claims, along with continuing claims staying above 1.9 million for 16 straight weeks, reinforces signs that the labor market is softening.
Consumer Inflation Largely Meets Projections: Inflation edged higher last month, with the Consumer Price Index (CPI) rising 0.4% in August. While slightly above the monthly forecast, annual inflation came in at 2.9% – right in line with expectations. The uptick in headline inflation was mainly driven by higher energy costs, especially gasoline prices which rose nearly 2%. Core inflation, which excludes food and energy, increased 0.3% for the month and held steady at 3.1% year-over-year – both broadly matching analyst projections. Shelter remains the largest contributor to inflation, while other notable drivers in August included airline fares and used vehicles. With inflation largely meeting expectations and the job market showing clear signs of cooling, the Fed appears likely to pivot its focus from inflation control to supporting employment.