We firmly believe timely and relevant data is key to making good decisions. To this end, we are committed to providing our community and clients with actionable data and insights about the local real estate market.
Local real estate market
With the data from September 2026 in, here’s an overview of the key aspects of the local real estate market. The real estate data below is collected from Northwest Multiple Listing Service (NWMLS).
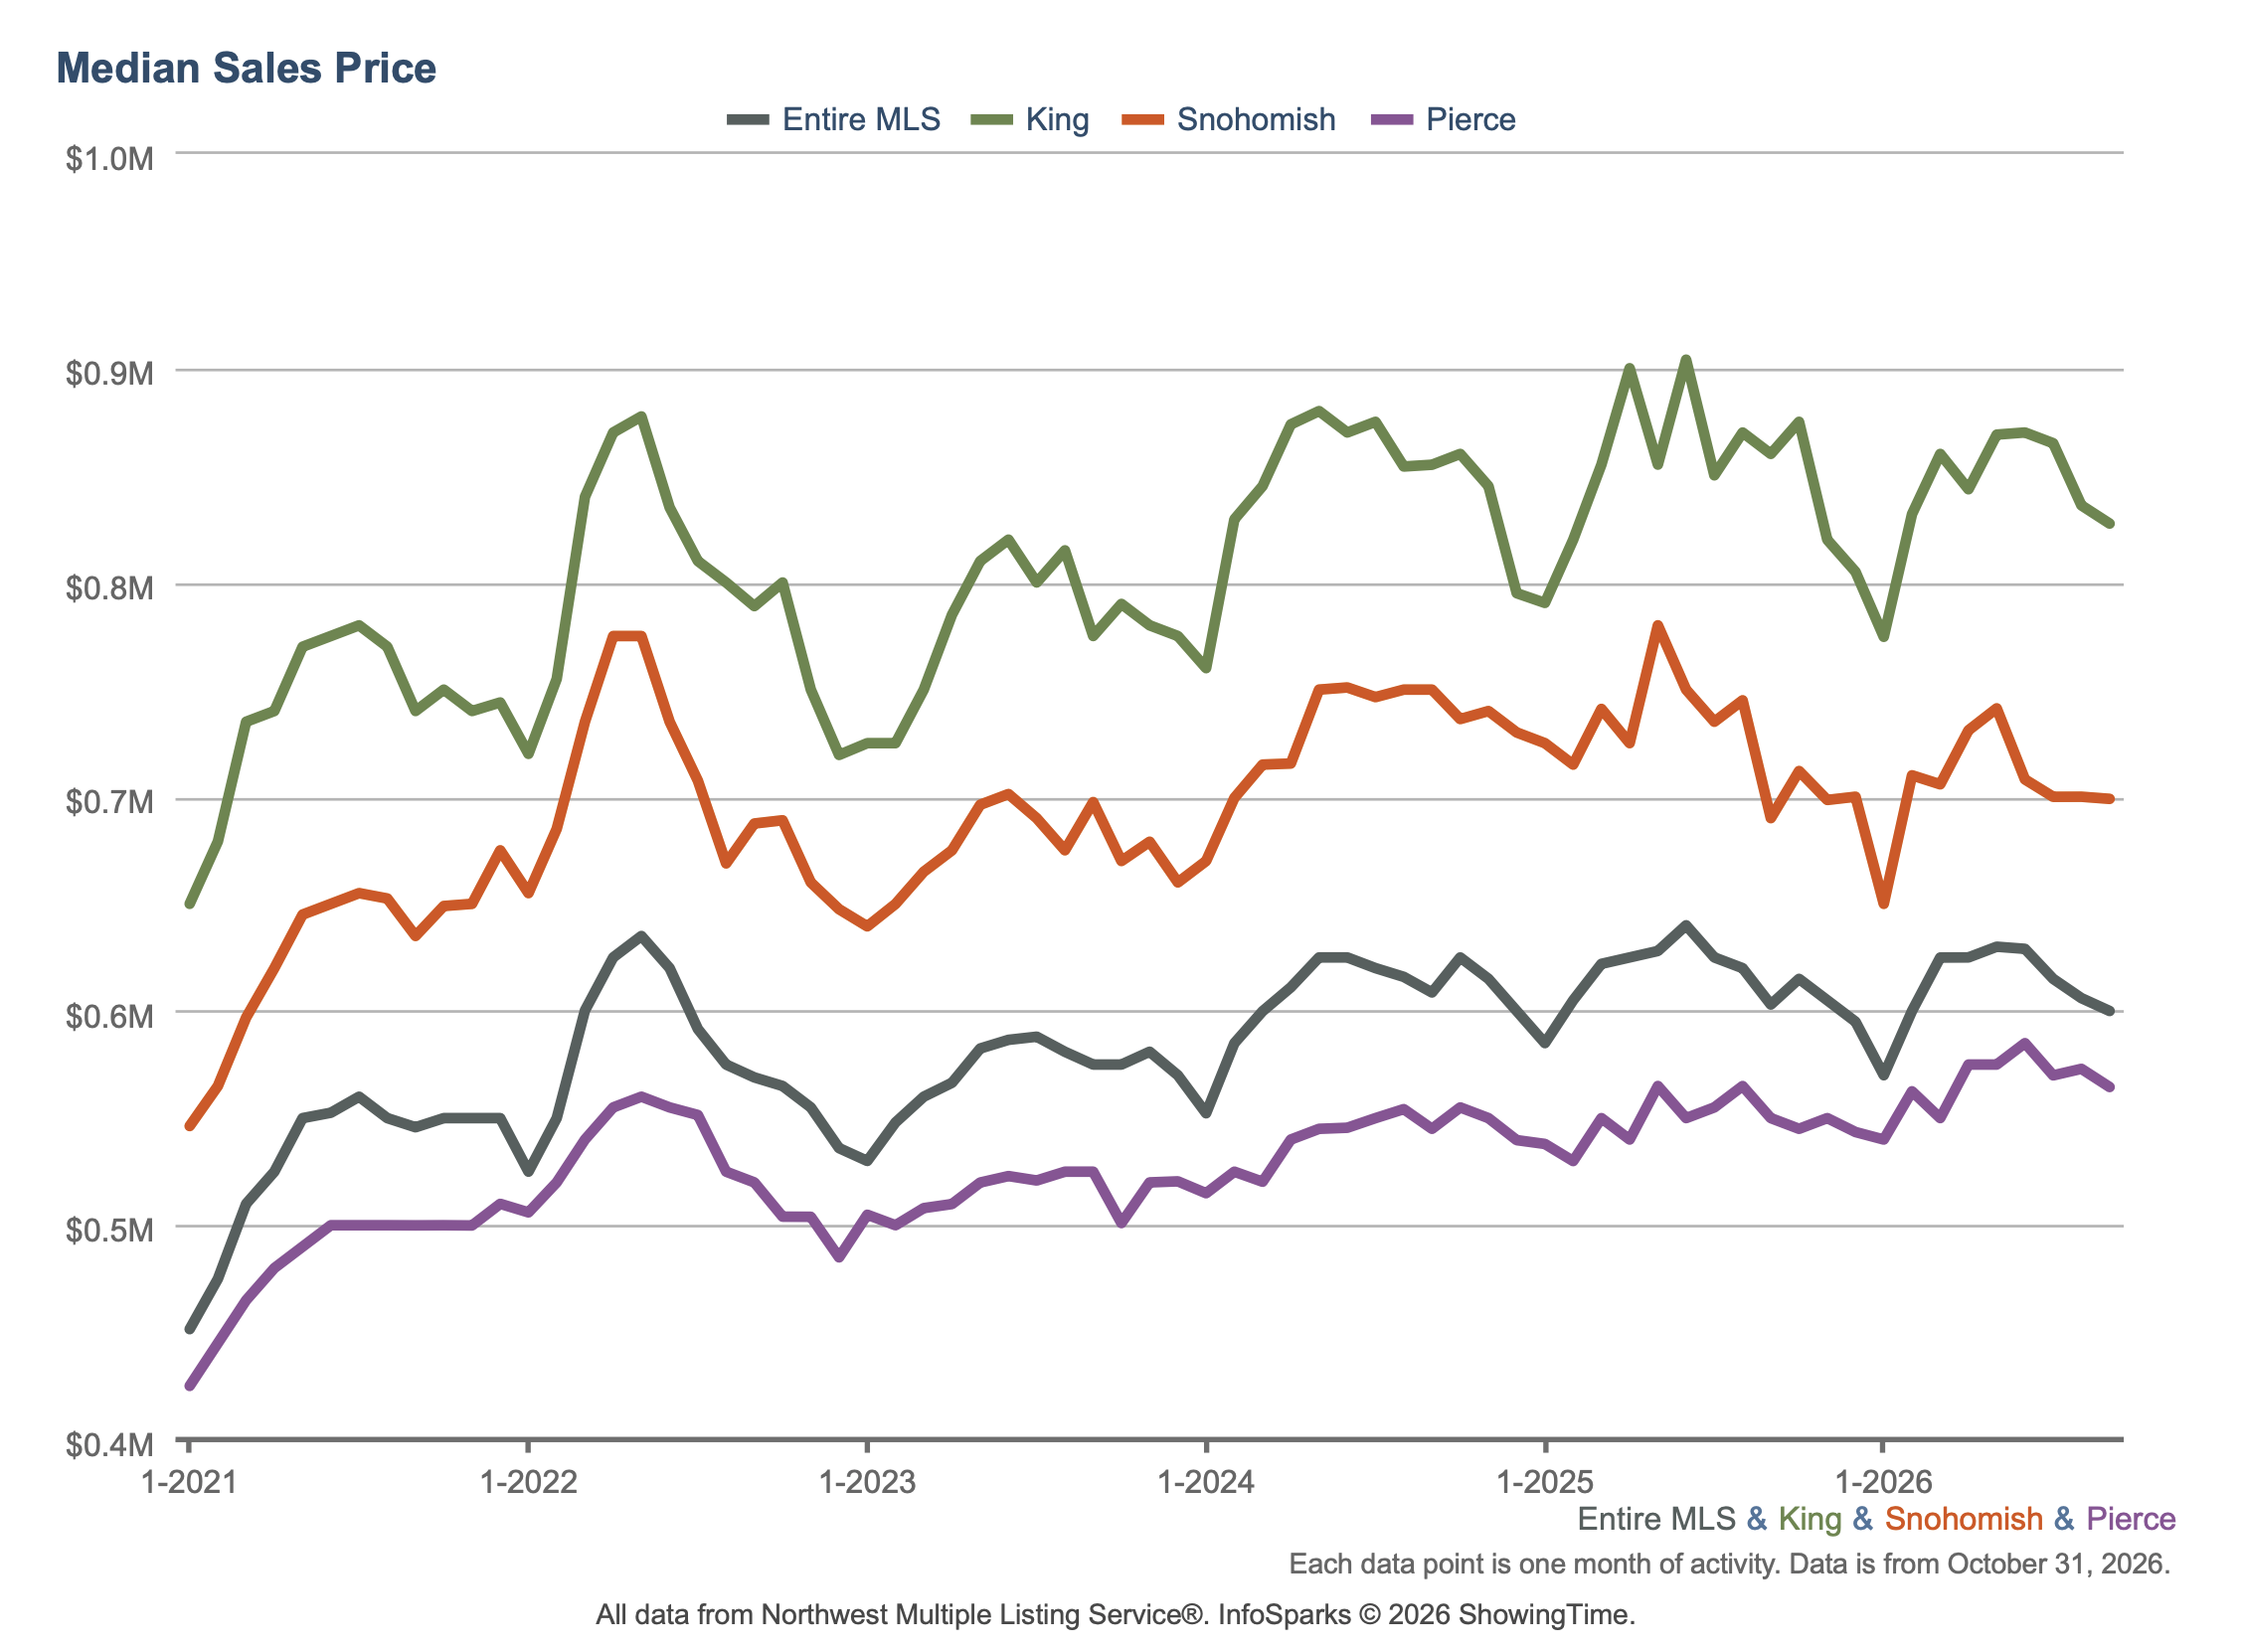
Median price: The chart below shows the latest median sales prices of homes over the past 5 years in the Greater Seattle area:
Homes sold: 5,623 homes and condominiums were sold in September 2026, representing an 8.9% decrease year-over-year (compared to 6,170 in September 2025). Of these closed sales, 4,970 were residential homes and 653 were condominiums.
Active listings: The total number of properties listed for sale increased 24.5% year-over-year, with 24,965 active listings on the market at the end of September 2026 (compared to 20,052 at the end of September 2025), giving buyers access to more than 4,900 additional homes.
Months of inventory: Given the current pace of sales, it would take approximately 4.44 months for every listed home to sell (up from 3.25 months in September 2025). A balanced market is generally considered to have 4 to 6 months of inventory. The counties with the lowest months of inventory were Kitsap (2.58), Clallam (3.21), Clark (3.30), Thurston (3.69), and Pierce (3.79), indicating tighter market conditions in those areas.
Median price: The median sales price for residential homes and condominiums sold in September 2026 stood at $625,000, a 0.9% decrease compared to September 2025 ($630,700). The counties with the highest median sales prices were San Juan ($885,000), King ($850,000), and Snohomish ($720,000), while the lowest median prices were recorded in Adams ($307,500), Grays Harbor ($310,000), and Pacific and Ferry ($325,000 each).
New listings: 9,996 new listings were added to the NWMLS database in September 2026, representing a year-over-year increase of 8.7% (compared to September 2025, when 9,193 listings were added).
Pending sales & market dynamics: There were 6,231 units under contract in September 2026, marking a 15.1% decrease year-over-year. Supply continued to outpace demand, with buyers going under contract on about 62 homes for every 100 new listings added (down from about 80 a year prior).
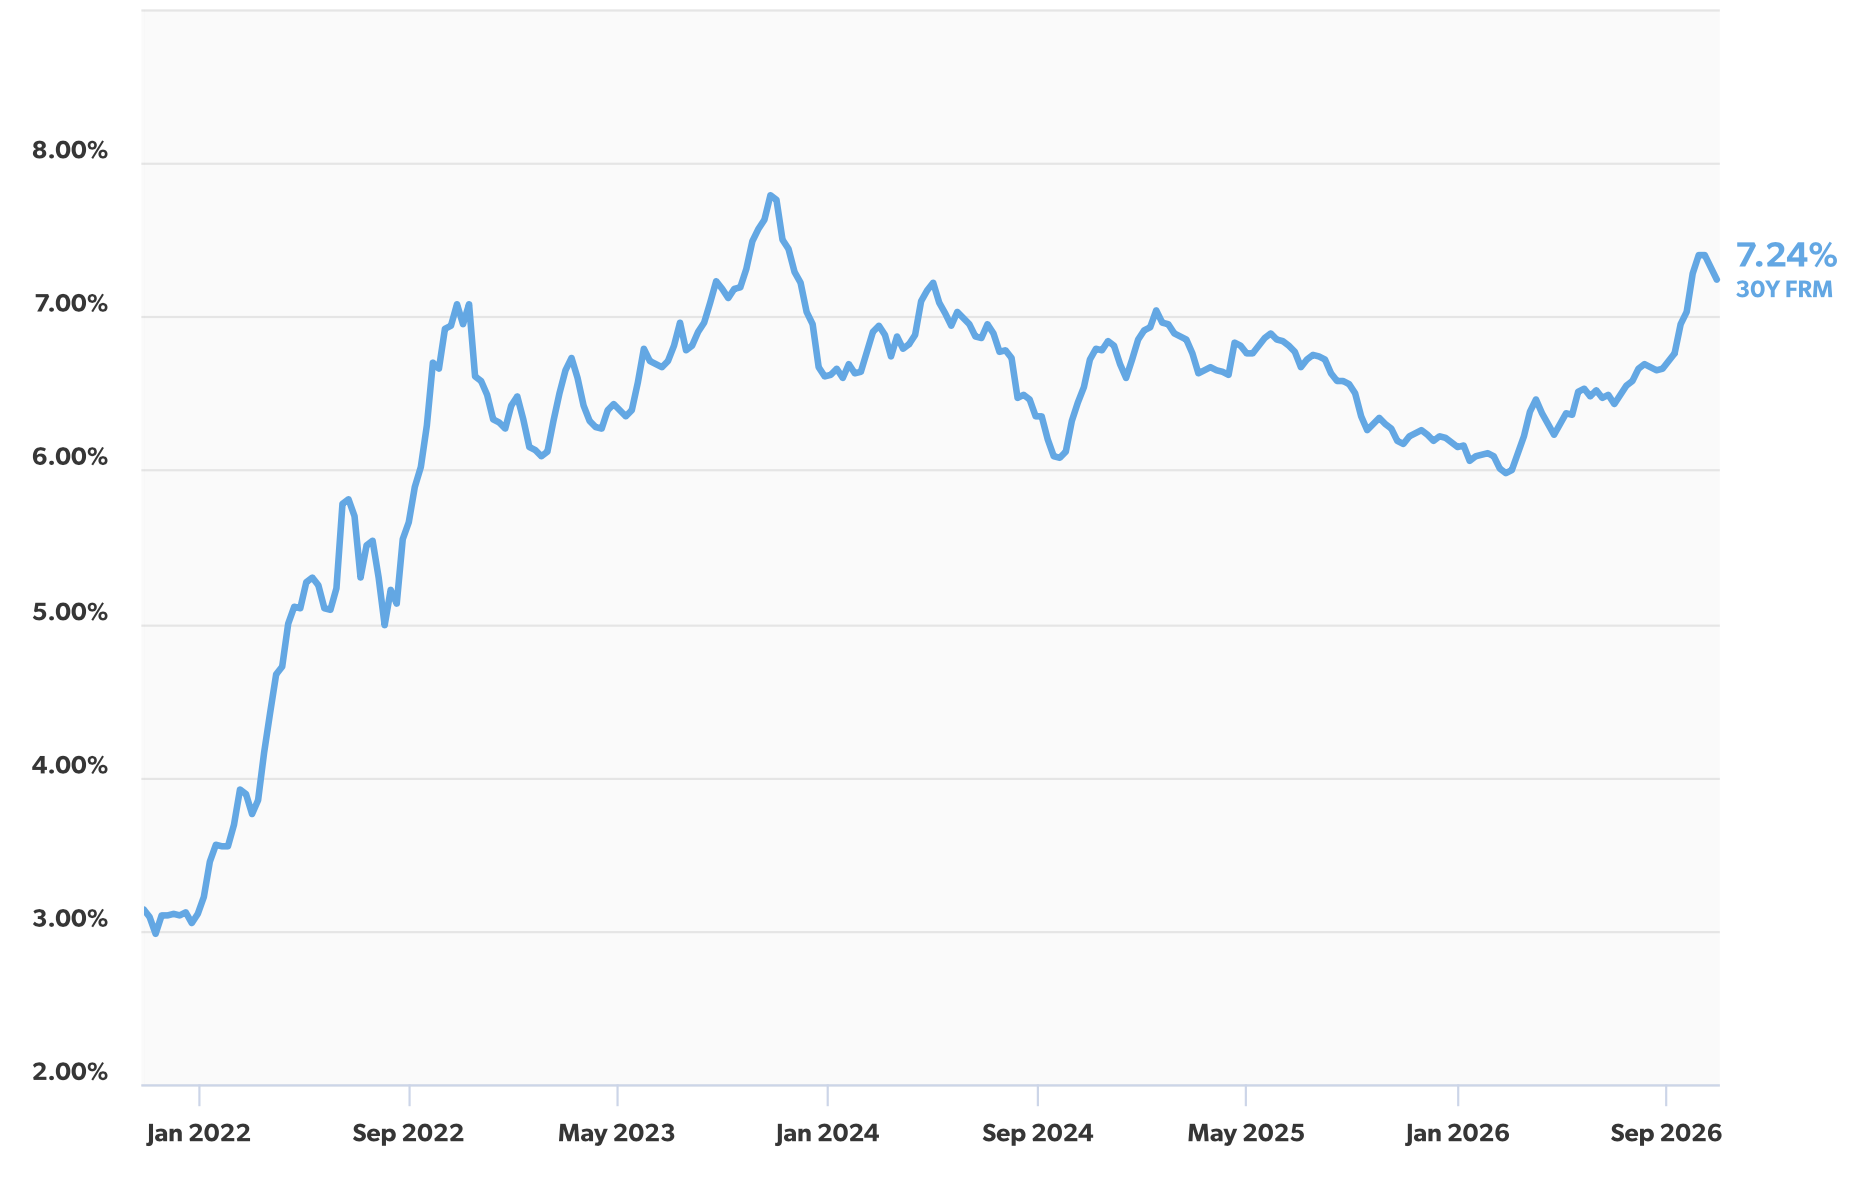
Primary Mortgage Market Survey — Average 30-Year Fixed Mortgage Rates over the past 5 years (Source: Freddie Mac)
Broader U.S. economy
Pending Home Sales Fall Sharply: Pending home sales, which measure signed contracts for existing homes, fell 7.3% from August to September and 11.3% year over year. All four U.S. regions saw declines over both periods.
Homebuilding Loses Momentum: New home construction slowed in September, with housing starts falling 5.2% from August to an annual pace of 1.22 million homes, below expectations. Housing starts measure how many homes begin construction. Meanwhile, home completions fell 14% year over year to an annual pace of 1.19 million, as builders contend with softer demand and higher costs. Building permits, a gauge of future construction, also edged down 0.2% from August to an annual pace of 1.4 million. Builder confidence continues to weaken amid elevated mortgage rates, labor shortages, and rising energy and material costs. The National Association of Home Builders’ Housing Market Index fell three points in October to 29, its lowest level in 14 years. A reading below 50 indicates that more builders view market conditions as poor than good.