Market Update — October 2024

We firmly believe timely and relevant data is key to making good decisions. To this end, we are committed to providing our community and clients with actionable data and insights about the local real estate market.
Local real estate market
With the data from September 2024 in, here’s an overview of the key aspects of the local real estate market. The real estate data below is collected from Northwest Multiple Listing Service (NWMLS).
Median price: The chart below shows the latest median sales prices of homes over the past three years in the Greater Seattle area over the past three years:
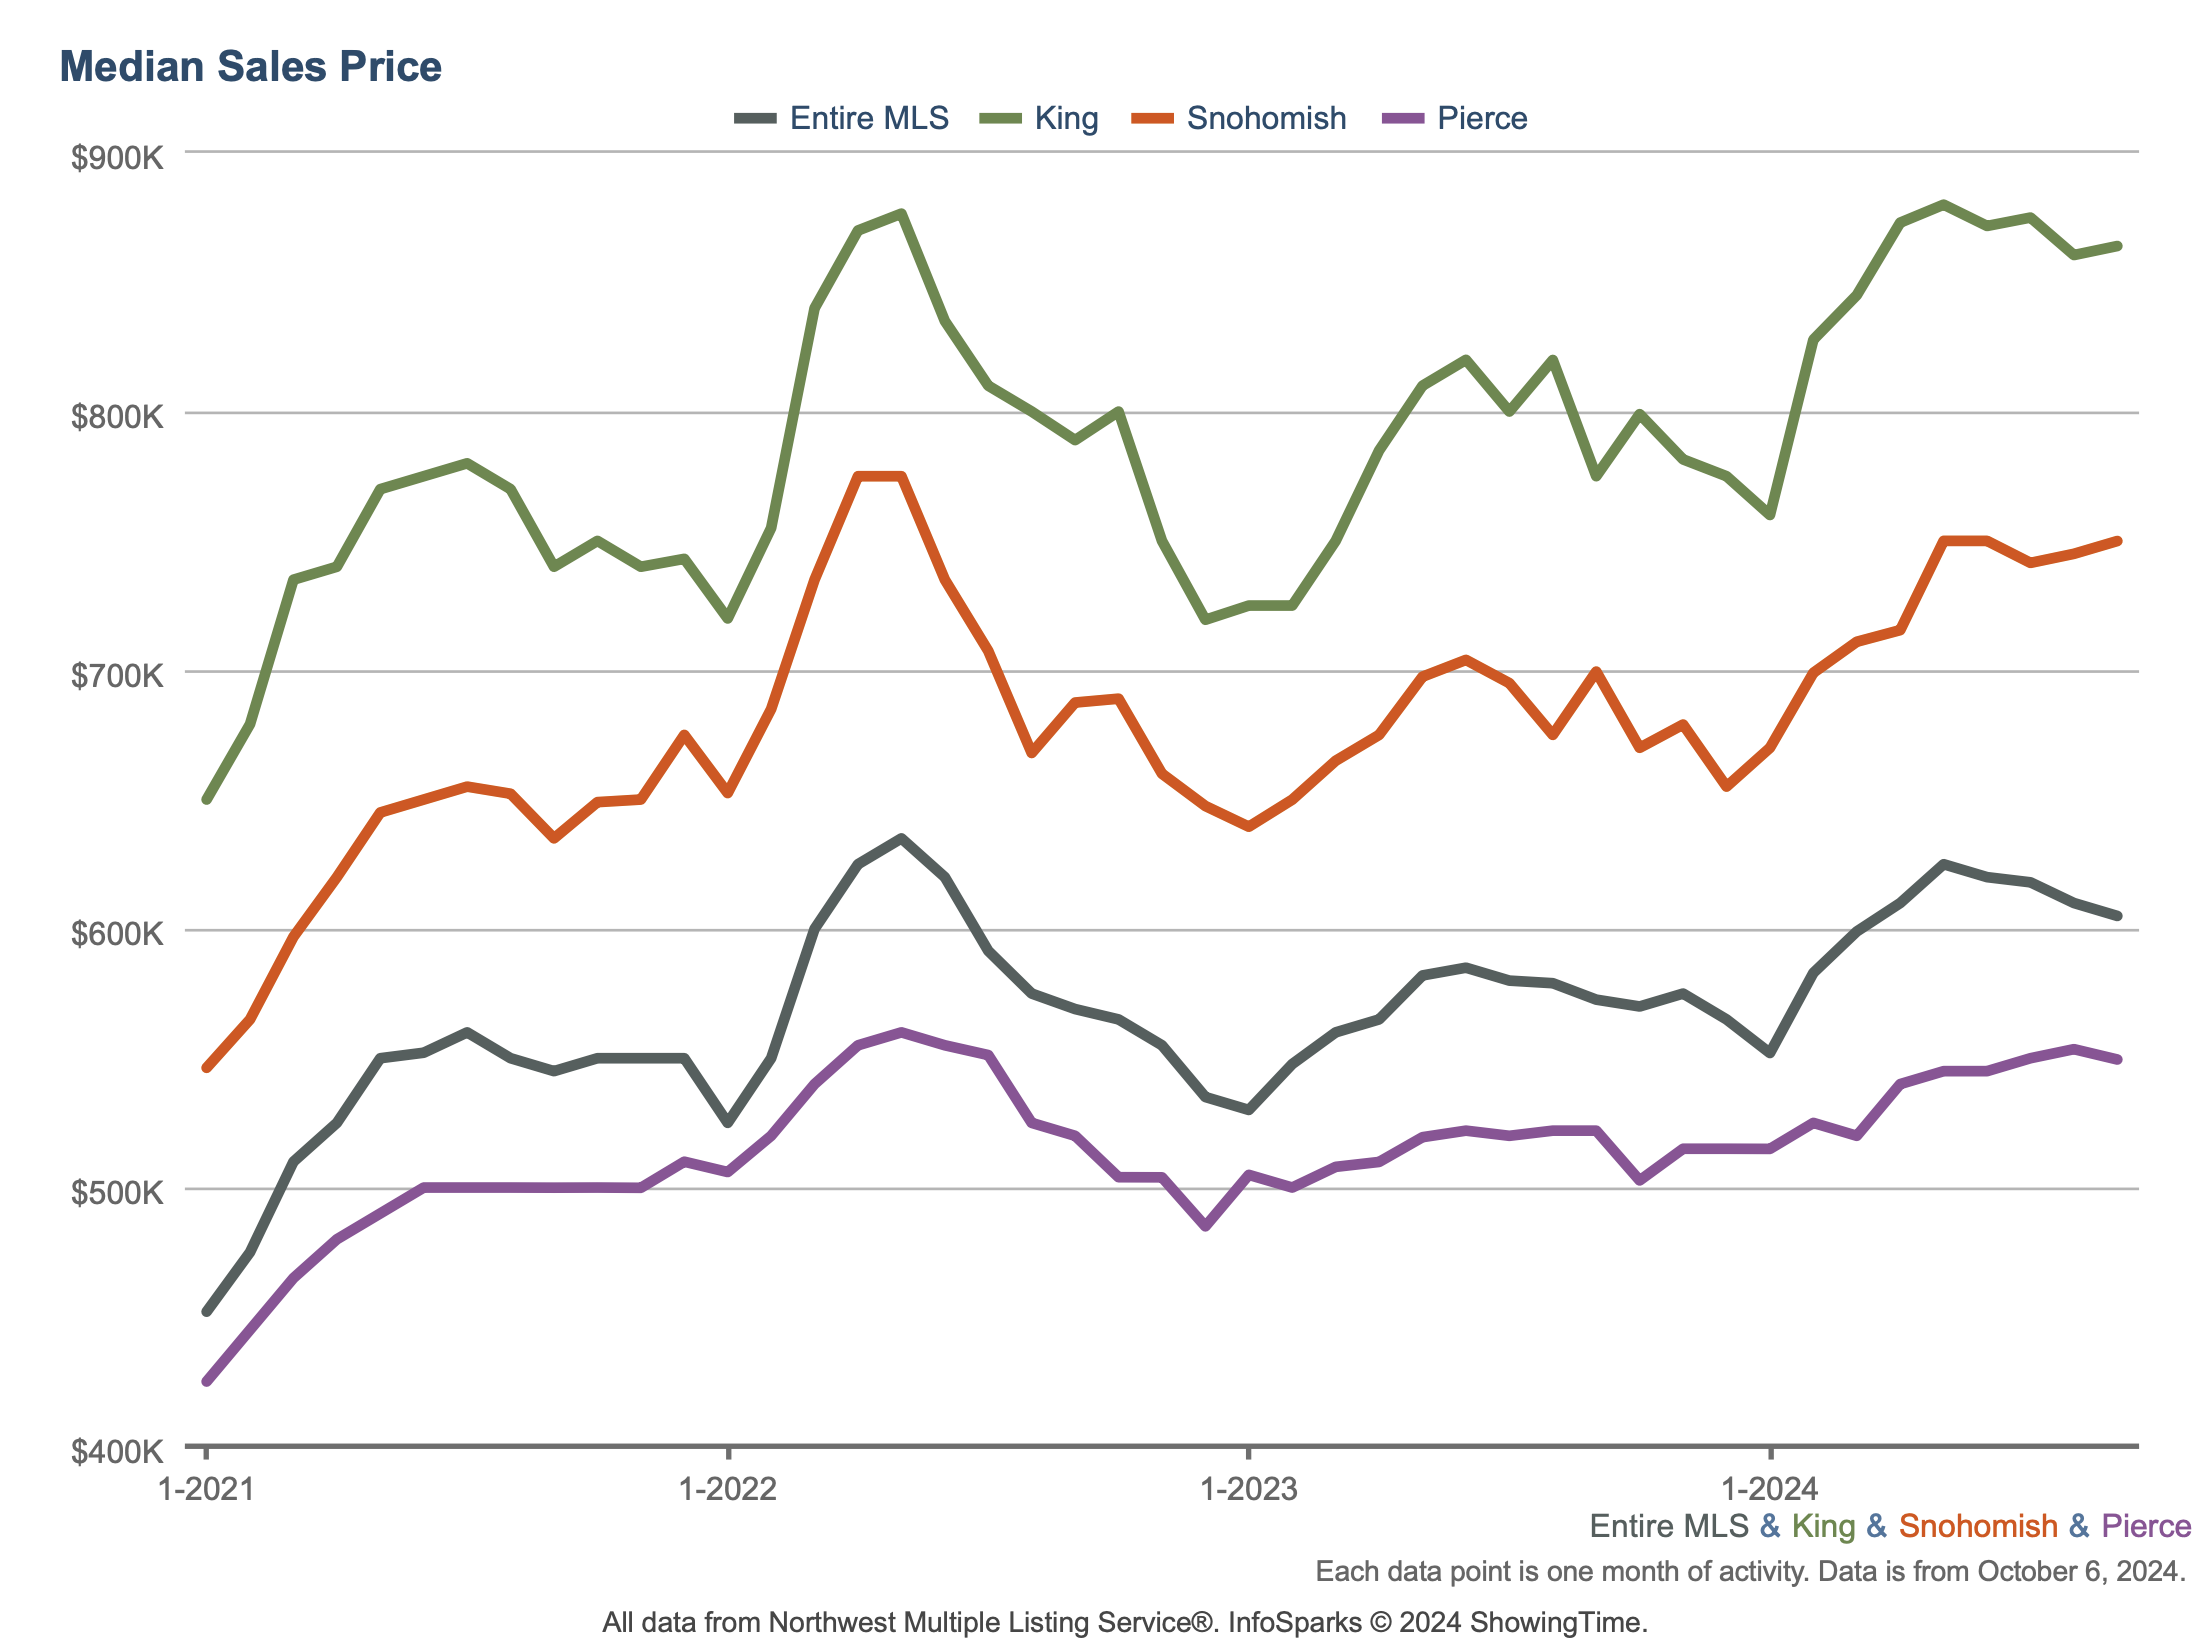
Homes sold: 5,828 homes were sold in September 2024. The median price of $635,000 which represents a 5.8% growth YOY. This total sale volume translates to a dollar value of about $4.6B.
New construction: 815 new construction homes were sold in September 2024. The median sale price of new construction homes was $730,000.
Months of inventory: Given the current quantity of supply, it’ll take 2.7 months for every listed home to sell. To put this number in context, note that the months of inventory for a balanced market is considered to be 4 to 6 months. The counties with the lowest months of inventory in September 2024 were Snohomish (1.62), Kitsap (1.93), Thurston (2), and Pierce (2.34). The data indicates the persistent shortage of supply relative to demand.
New listings: 8,508 new listings were added to the NWMLS database in September 2024 representing an increase of 12.7% compared to September 2023.
Mortgage rates: This month the Freddie Mac rate continued to edge down arriving at a range comparable not seen since February 2023.

Average 30-Year Fixed Mortgage Rates over the past 12 months (Source: Freddie Mac)
Broader economy
Consumer Inflation Trending in Right Direction: August’s Personal Consumption Expenditures (PCE) showed that headline inflation rose 0.1% from July, while the year-over-year reading fell from 2.5% to 2.2%. Core PCE, the Fed’s preferred method which strips out volatile food and energy prices, also rose 0.1% monthly. The year-over-year reading ticked higher from 2.6% to 2.7%, remaining near the lowest level in three years.
Another Record High for Home Prices: The Case-Shiller Home Price Index, which is considered the “gold standard” for appreciation, showed home prices nationwide rose 0.2% from June to July after seasonal adjustment, breaking the previous month’s all-time high. Home values in July were also 5% higher than a year earlier, following a 5.5% gain in June. Case-Shiller’s 10-city (+6.8% YoY) and 20-city (+5.9% YoY) indices showed even higher growth than the nationwide figures, showing that big cities are outperforming the rest of the nation. In addition, lower-priced homes appreciated at a faster rate than the overall market, which makes sense as there is greater demand at the lower end of the market.