Market Update — August 2026

We firmly believe timely and relevant data is key to making good decisions. To this end, we are committed to providing our community and clients with actionable data and insights about the local real estate market.
Local real estate market
With the data from July 2026 in, here’s an overview of the key aspects of the local real estate market. The real estate data below is collected from Northwest Multiple Listing Service (NWMLS).
Median price: The chart below shows the latest median sales prices of homes over the past 5 years in the Greater Seattle area over the past five years:
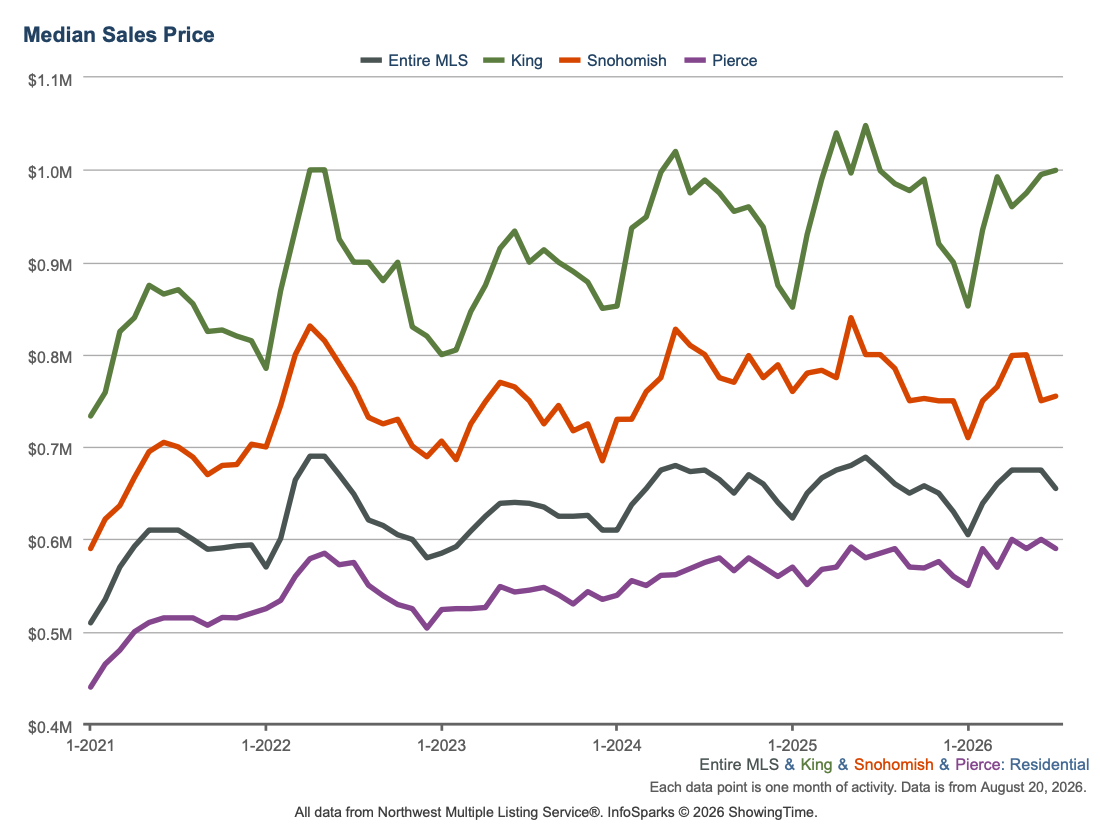
Homes sold: 6,649 homes and condominiums were sold in July 2026, representing a 3.2% decrease year-over-year (compared to 6,867 in July 2025). The median price stood at $640,000, showing a 1.5% decrease YOY. This total sales volume translates to a combined dollar value of about $5.36 billion ($4.90 billion for residential homes and $463.6 million for condominiums).
Months of inventory: Given the current pace of sales, it would take approximately 3.74 months for every listed home to sell. To put this number in perspective, a balanced market is generally considered to have 4 to 6 months of inventory. The counties with the lowest months of inventory were Kitsap (2.28), Snohomish (3.01), Pierce (3.04), Thurston (3.11), and Clallam (3.23), indicating tighter market conditions in those areas.
Median price: The counties with the highest median sales prices were San Juan ($880,000), King ($879,500), and Snohomish ($719,000), while the lowest median prices were recorded in Ferry ($199,900), Columbia ($240,000), and Okanogan ($321,500).
New listings: 11,517 new listings were added to the NWMLS database in July 2026, representing a year-over-year increase of 10.5%.
Mortgage rates: Higher mortgage rates continued to influence buyer activity during the month.
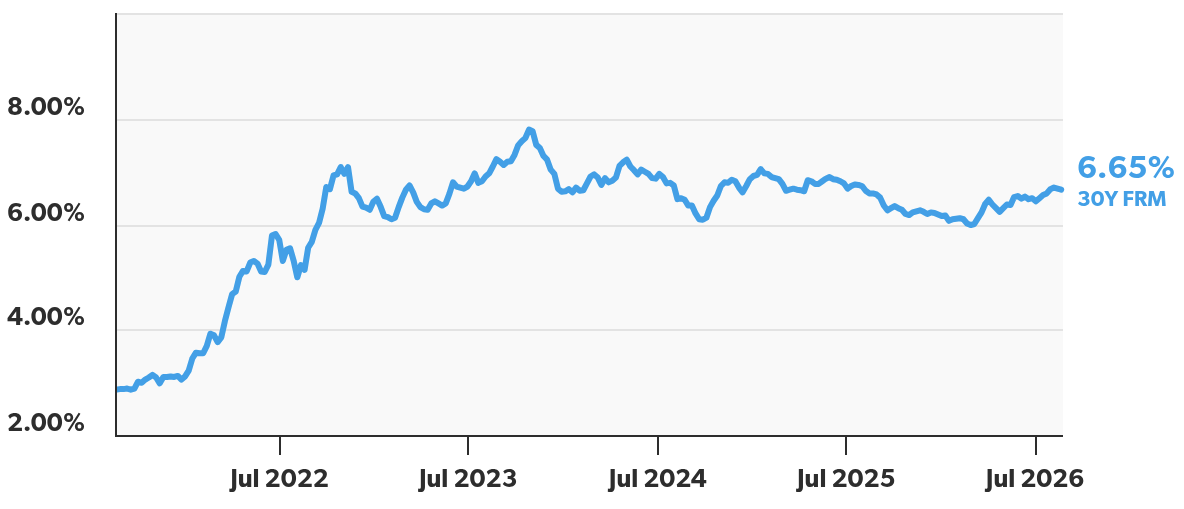
Primary Mortgage Market Survey — Average 30-Year Fixed Mortgage Rates over the past 5 years (Source: Freddie Mac)
Broader U.S. economy
Inflation Data Shows Encouraging Signs: July brought positive inflation news, with both consumer and wholesale prices coming in at or below expectations. The CPI report showed consumer prices rising just 0.1% in July, bringing annual inflation down to 3.4%. Gasoline prices did rise during the month, but the average price was still lower than in June, which helped keep overall inflation in check. Core inflation, which excludes food and energy, rose 0.2% from June and slowed to 2.5% over the past year.Wholesale prices were also more subdued than expected, coming in essentially flat for the month. On an annual basis, both headline and core wholesale inflation moved lower.
Existing Home Sales Slow in July: Existing home sales fell 1.7% from June to July, marking the second consecutive monthly decline and bringing the seasonally adjusted annual rate to 4.06 million homes. Still, sales were 0.7% higher than a year ago. Inventory also dipped 1.9% from June.